Aggregation Function in Tableau
In this article, we will discuss different aggregation functions in tableau with the help of examples. We will also discuss how to create Aggregation Function in Tableau.
Table of Content
Best-suited Tableau courses for you
Learn Tableau with these high-rated online courses
Why use the Aggregation Function?
Aggregate functions in Tableau is a type of function that groups values of multiple rows together as an input to a single value of more significant meaning. It allows to summarize or change the level of detail of the given data.
In simple terms, aggregation functions perform a calculation on the set of values and return a single value.
Let’s understand why to use the aggregation function with help of an example:
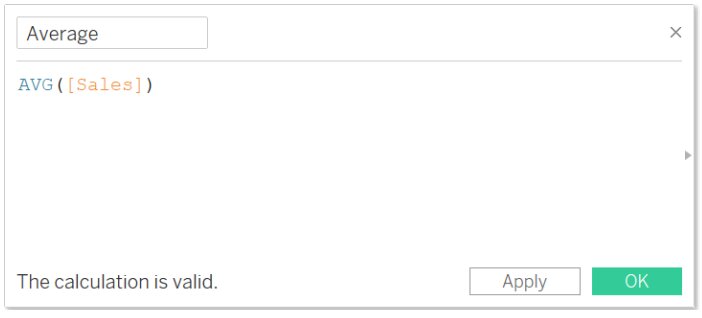
In Sample Superstore data, find the average sales of data.
Then, we can use the formula:
Must Check: What is Tableau?
Must Check: Tableau Online Courses & Certifications


Now, we will see how to create an aggregation calculation in Tableau.
Create an Aggregation Calculation
We will understand how to create an aggregation calculation with the help of an example using Sample Superstore data.
Problem Statement: Find the region-wise average sales of each segment (Consumer, Corporate, and Home Office).
Steps to Create
- Connect the Sample Superstore Data
- Select Analysis -> Create Calculated Field
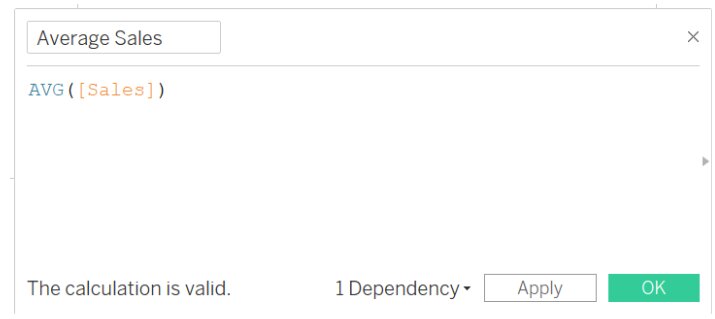
- Enter the name “Average Sales”
- Write the formula
The above formula will show the average sales of the data.
- Click OK
- The new calculated field (Average Sales) appears in Data Pane under the measure
Note: Aggregation calculations are always measures.
- Drag and drop Region in column and Segment, and Average Sales in row shelf
- Drag and drop Region to color in the Marks Pane
In the above image, we get that the average sales of each segment (Corporate and Home Office) in the South region are maximum except Consumer Segment.
Rules for Aggregation Calculation
- The result of an aggregate calculation is always a measure
- Aggregated Values can’t be combined with disaggregated values
- Constant values work both as Aggregated and Disaggregated values
- The argument to any given function must either all aggregated or all disaggregated


Aggregation Function in Tableau
SUM
- It will return the sum of all the selected expression
- It can be used only with numeric values
- NULL values are ignored
- Syntax: SUM (expression)
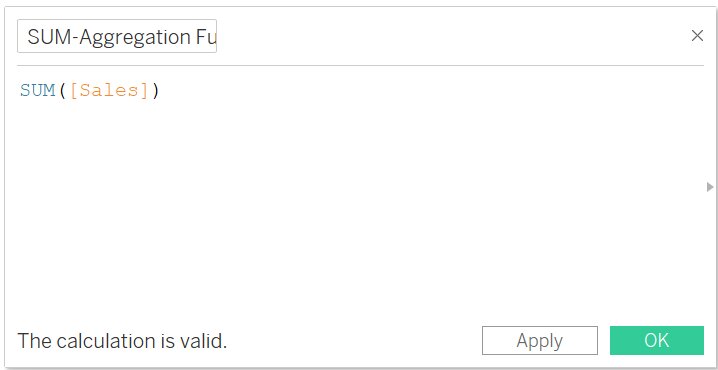
- Example:
The above formula will return the sum of sales of the data.
AVG
- It will return the average of all the selected expression
- It can be used only with numeric values
- NULL values are ignored
- Syntax: AVG(expression)
- Example
The above formula will show the average sales of the data.
CORR
- It will return the correlation coefficient (Pearson Correlation) between the two expression
- Pearson correlation measures the linear relationship between two variables (here, field)
- The value of Pearson Correlation varies from -1 to 1 (both inclusive)
- -1: Exact Negative Linear Relationship
- 0: No Linear Relationship
- 1: Exact Positive Linear Relationship
- Syntax: CORR ( expression1, expression2)
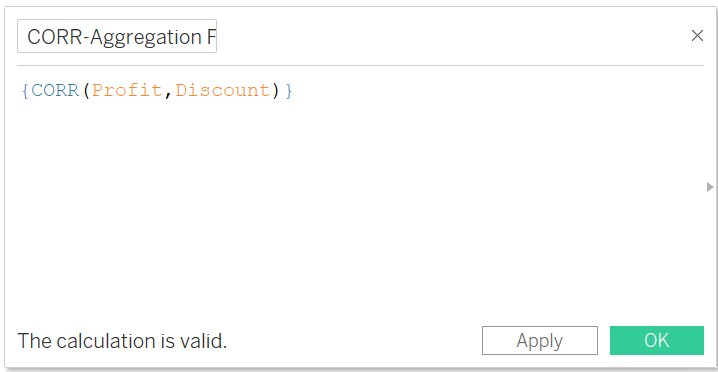
- Example:
The above formula will return the correlation between Profit and Discount.
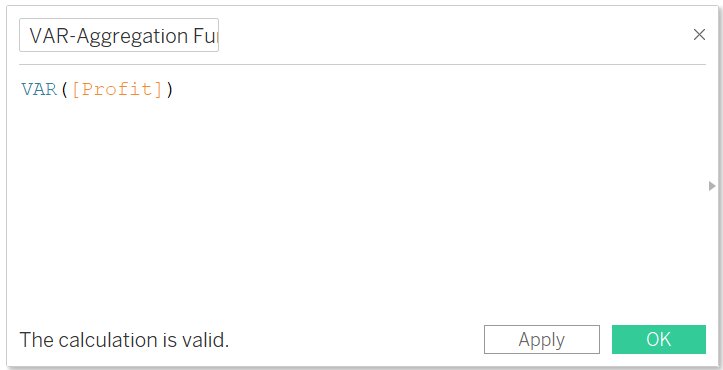
VAR
- Return the variance of all the selected values based on the sample of the population
- Variance is a measure of Variability
- Syntax: VAR(expression)
- VARP: It is the same as variance but returns the values based on the entire population
- Syntax: VARP(expression)
The above formula will return the variance of profit data.
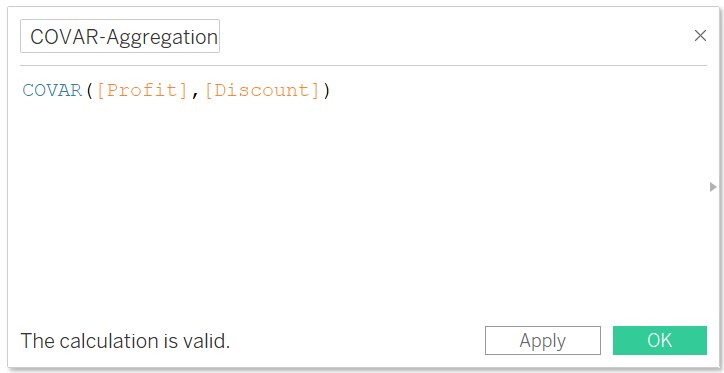
COVAR
- It will return the Sample Covariance of two expression
- It measures the relationship between two random variables and to what extent, the two variables will change together
- Positive Covariance: Implies that both the variables tend to move in the same direction
- Negative Covariance: Implies that both the variable tend to move in the opposite direction
- Syntax: COVAR (expression 1, expression 2)
- COVARP: It will return the population covariance of two expression
- Syntax: COVARP (expression 1, expression 2)
- Example:
The above function will return the covariance between Profit and Discount.
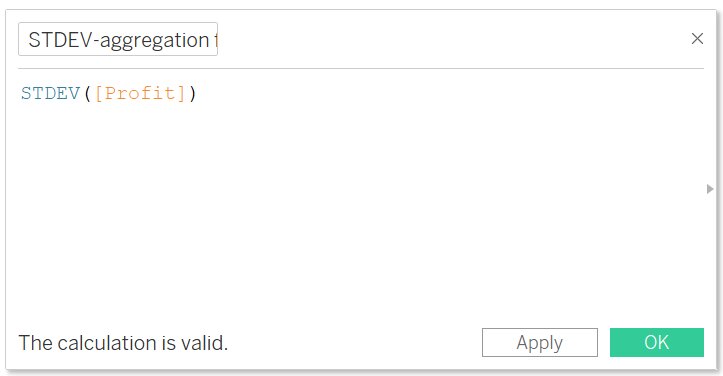
STDEV
- It will return the standard deviation based on a sample population
- Calculated as a square root of the variance
- Syntax: STDEV (expression)
- STDEVP: It will return the standard deviation based on a biased population
- Syntax: STDEVP (expression)
- Example:
The above function will return the standard deviation of profit data.
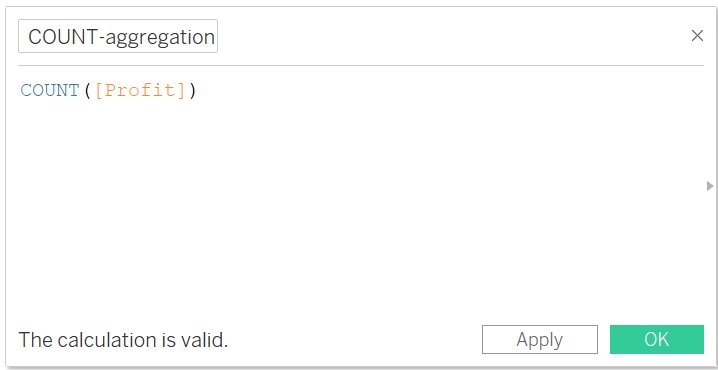
COUNT
- It will return the number of items in a group (or the selected expression)
- Syntax: COUNT(expression)
Note: NULL values are not counted
- Example:
It will return the number of entries in Profit field.
COUNTD
- It will return the number of distinct items in a group (or the selected expression)
- Syntax: COUNT(expression)
Note: NULL values are not counted.
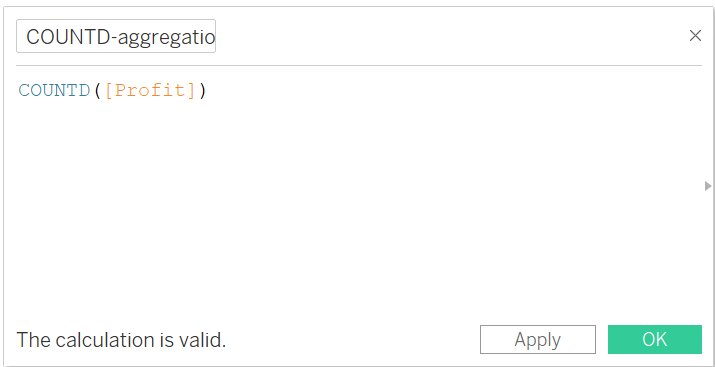
- Example:
It will return the number of distinct entries in the Profit field.
MAX/MIN
- It will return the maximum/minimum of an expression across all the selected records.
- If the expression is a string value:
- MAX: function will return the last value (last is defined by alphabetical order)
- MIN: function will return the first value (first is defined by alphabetical order
- Syntax: MAX (expression) / MIN (expression)
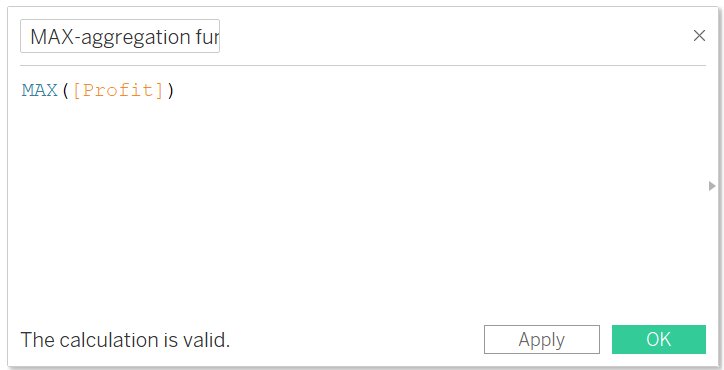
- Example:
It will return the maximum of Profit field.
MEDIAN
- Returns the median of an expression across all the selected records
- Works only with the numeric values
- NULL values are ignored
- Syntax: MEDIAN (Expression)
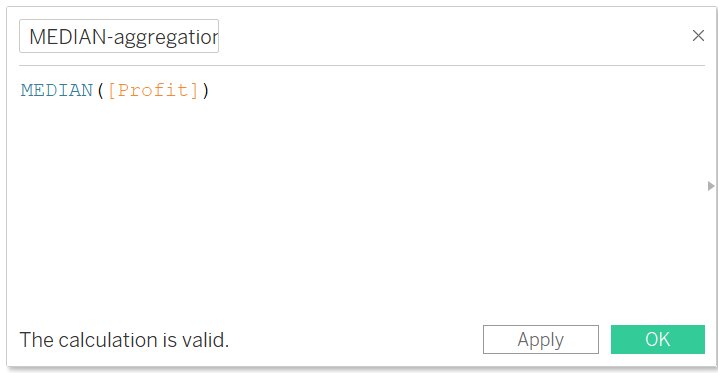
- Example:
It will return the median profit.
Conclusion
In this article, we have discussed different aggregation functions in tableau with the help of examples. We also discussed how to create Aggregation Function in Tableau.
Hope this article, will help you in your data analytics journey.
Top Trending Articles:
Introduction To Tableau | Products Of Tableau | Data Types In Tableau | Change Data Type In Tableau | File Type In Tableau | Data Aggregation | Connecting Data In Tableau | Dimension And Measure | Tableau Show Me | Joins In Tableau | Union In Tableau | Operators In Tableau | Number Functions In Tableau | String Functions In Tableau | Filter In Tableau | Context Filter In Tableau | Filters In Tableau | Types Of Charts In Tableau | Bar And Line Chart In Tableau | Pareto Chart In Tableau | Gantt Chart In Tableau | Box And Whisker Chart In Tableau | Waterfall Chart In Tableau | Donut Chart In Tableau | Funnel Chart In Tableau | Dual Axis Chart In Tableau | Sort Data In Tableau | Tableau Sets | Groups In Tableau | Tableau Hierarchy | Tableau Forecasting | Highlighting In Tableau | Word Cloud In Tableau | Cohort Analysis In Tableau


