How to Create Calculated Field in Tableau
In this article, we will discuss how to create and use the calculation in Tableau, and we will also discuss why to use calculated fields in Tableau.
Table of Content
Best-suited Tableau courses for you
Learn Tableau with these high-rated online courses
What are Calculated Fields
In the tableau, columns in the dataset (or database) are known as fields, where Calculated Field is a field (or columns) that uses the fields of the given dataset and applies additional logic- it allows the creation of a new field from the given dataset.
Calculated field either:
- Do some calculations on the given fields of the dataset to create a value that is not present in the dataset
- Select values from the dataset based on the user-defined criteria
Note:
- The new calculated field is saved to your data source in Tableau and can be used the same way as the other fields in the data source.
- The original fields in the dataset remain unchanged.
Must Check: What is Tableau?
Must Check: Tableau Online Courses & Certifications
When to use Calculated Fields
Calculated fields are a flexible and efficient way to do analysis.
Some common scenarios where calculated fields are used in Tableau:
- The data you need for analysis is missing in the given dataset (or Data Source)
- Want to transform values in the visualisation
- Want to categorise data quickly
Examples of Calculated Fields in Tableau:
- Segment Data
- Aggregate data
- Convert Data Type
- Filter Data
- Calculate Ratios


Types of Calculation
There are three main types of calculation that we can use to create a Calculated Fields in the Tableau:
- Basic Expression
- Allows to transform values or members at the data source level of details (a row-level calculation) or at the visualization level of details ( an aggregation calculation)
- Level of Detail (LOD) Expressions
- Table Calculations
Create a Calculated Field
We will see how to create a calculated field with the help of an example.
Here, we will use the Sample Super Store Data.
Problem Statement: Calculate Profit Sale Ratio of products subcategories within different states.
Steps to Create Calculated Fields:
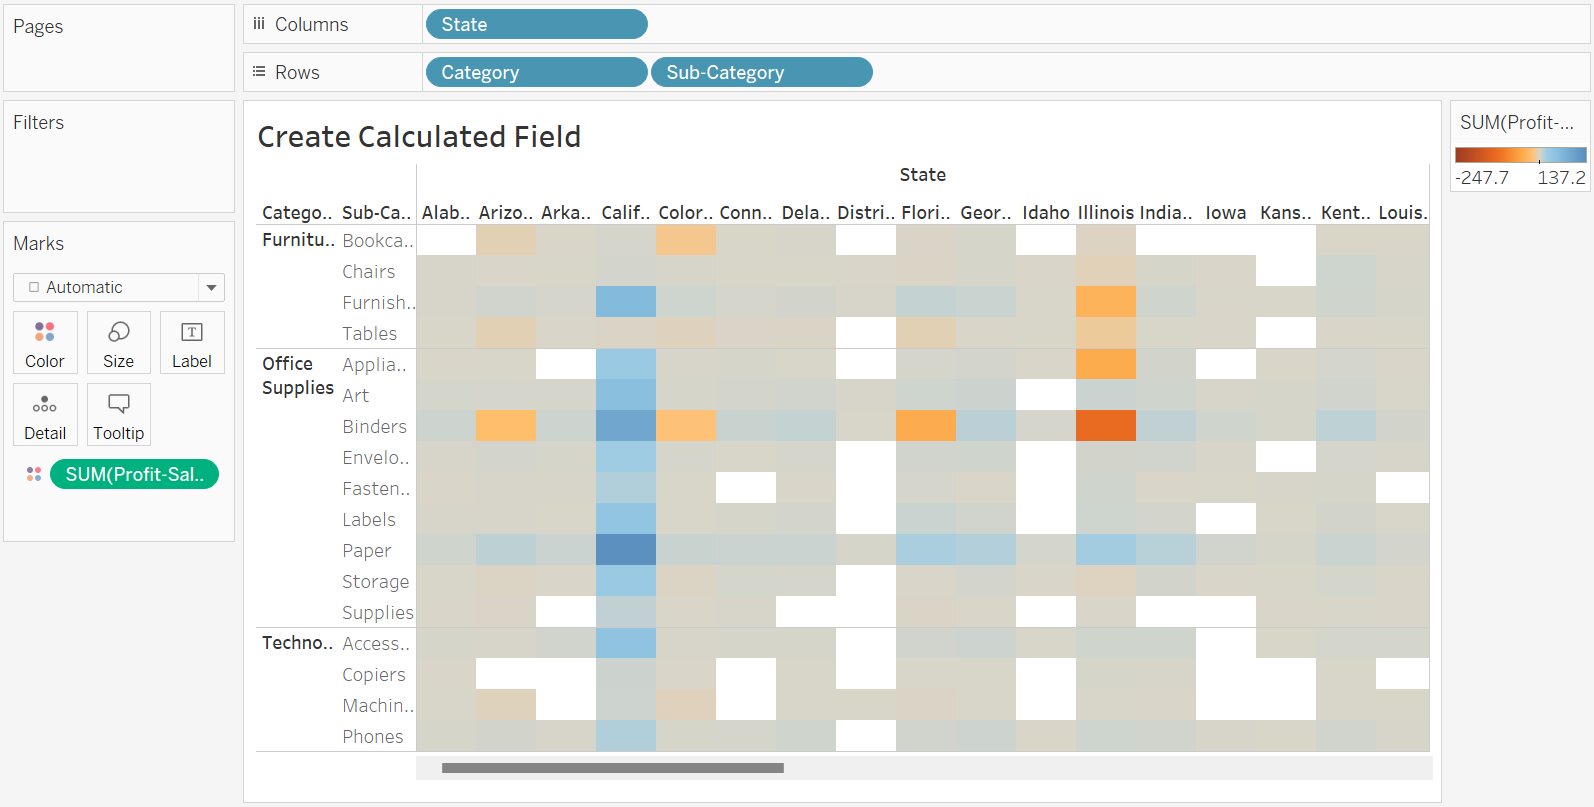
Build the View
- Connect the Sample Super Store Data
- Drag and Drop State into the column shelf
- Drag and Drop Category and Sub-Category into the row shelf
Create Calculated Field
- Select Analysis -> Select Create Calculated Field
- Enter the name Profit-Sale Ratio
- Enter the Formula
Note: The above formula:
- Checks Sales is not equal to zero
- If True, return Profit ratio ([Profit]/[Sales])
- If False returns 0
- Click OK
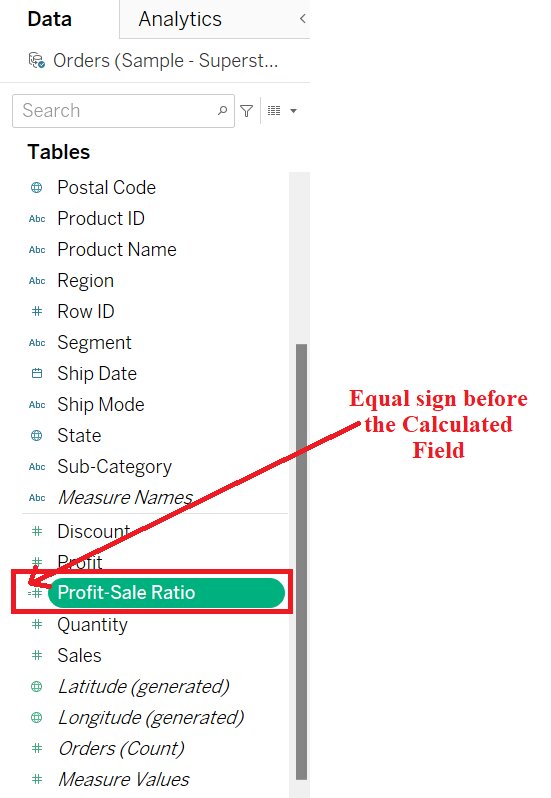
- New Calculated Field Profit-Sale Ratio is added in the Data Pane
Note: All the calculated fields have an equal sign (=) next to them in the Data Pane.
Add Calculated Field in the View
- Drag and Drop Profit-Sale Ratio on the Mark Card
Note: By Default, Profit-Sale Ratio is aggregated as a sum, we can change it to AVG, MEDIAN, MODE, Maximum, Minimum etc by
Right-Click on SUM(Profit-Sale Ratio) in the Mark Card -> Select Measure (SUM).

In this article, we will discuss one of the important concepts...read more


Additional Resource
Edit a Calculated Field
- Right Click on Profit-Sale Ratio in the Data Pane
- Select Edit
- Calculation Editor Dialog Box will appear with the previous formula, you can update
- Name of Calculated Field
- Formula
- Calculation Editor Dialog Box will appear with the previous formula, you can update
- Click OK
Tips for Working with Calculated Fields
- Drag and Drop fields into the Calculation Editor
- Drag and Drop formulas from the Calculation Editor back to Data Pane
- Use functions reference in the calculation editor
- To open the functions reference, click the triangle icon on the right side of the Calculation Editor Box.
Conclusion
In this article, we have discussed how to create and use the calculation in Tableau, and we will also discuss why to use calculated fields in Tableau.
Top Trending Articles:
Introduction To Tableau | Products Of Tableau | Data Types In Tableau | Change Data Type In Tableau | File Type In Tableau | Data Aggregation | Connecting Data In Tableau | Dimension And Measure | Tableau Show Me | Joins In Tableau | Union In Tableau | Operators In Tableau | Number Functions In Tableau | String Functions In Tableau | Filter In Tableau | Context Filter In Tableau | Filters In Tableau | Types Of Charts In Tableau | Bar And Line Chart In Tableau | Pareto Chart In Tableau | Gantt Chart In Tableau | Box And Whisker Chart In Tableau | Waterfall Chart In Tableau | Donut Chart In Tableau | Funnel Chart In Tableau | Dual Axis Chart In Tableau | Sort Data In Tableau | Tableau Sets | Groups In Tableau | Tableau Hierarchy | Tableau Forecasting | Highlighting In Tableau | Word Cloud In Tableau | Cohort Analysis In Tableau

Vikram has a Postgraduate degree in Applied Mathematics, with a keen interest in Data Science and Machine Learning. He has experience of 2+ years in content creation in Mathematics, Statistics, Data Science, and Mac... Read Full Bio


