Central Limit Theorem
Introduction
Central limit theorem one of the most important and used theorem in statistics and data science, it is in the heart of Hypothesis testing.
Being in the core of the data science and machine learning, it is quiet confusing.
So, in this we will briefly discuss Central limit Theorem, it’s , assumption and implementation in python.
Best-suited Statistics for Data Science courses for you
Learn Statistics for Data Science with these high-rated online courses
Table of Content:
- Central Limit Theorem
- Mean and Standard Deviation of Sample Mean
- Assumption for Central Limit Theorem
- Implementation in Python
Central Limit Theorem
Then the distribution of the sample mean will be approximately normally distributed regardless of whether the population is normal or skewed.
Provided that sample size is sufficiently large (n > 30).
To know more about mean and variance read the article Measure of Central Tendency and Measures of Dispersion.
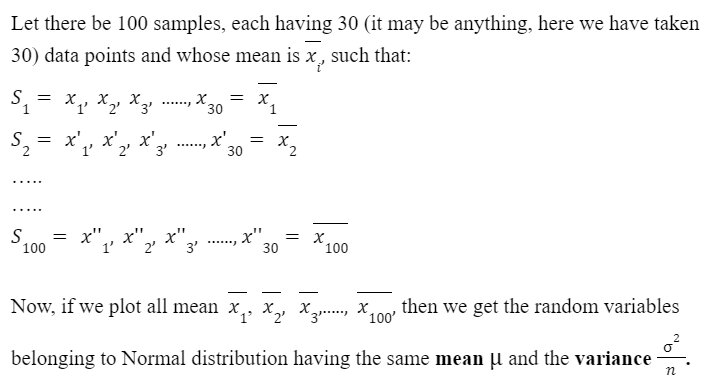
Confused! So let’s understand it through an example:
Mean and Standard Deviation of Sample Mean
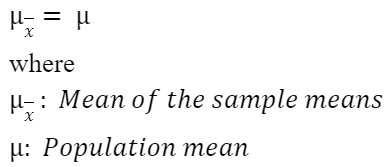
Mean of the sample means:
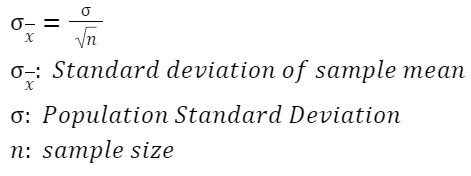
Standard deviation of the sample means:
Assumptions
- Data must be randomly sampled
- Samples should be independent
- Sample size should be sufficiently large
- When population is skewed, sample size should be large
- When population is symmetric, sample size of 30 is sufficient
- Sample size should not be more than 10% of the population (when sampling is done without replacement)
Implementation in Python
Before directly going for python implementation, let’s understand the step by step process:
Let X be any random variable having finite mean and variance
- Randomly pick m samples each of size n
- Calculate the mean of each sample
- Plot the distribution of m samples
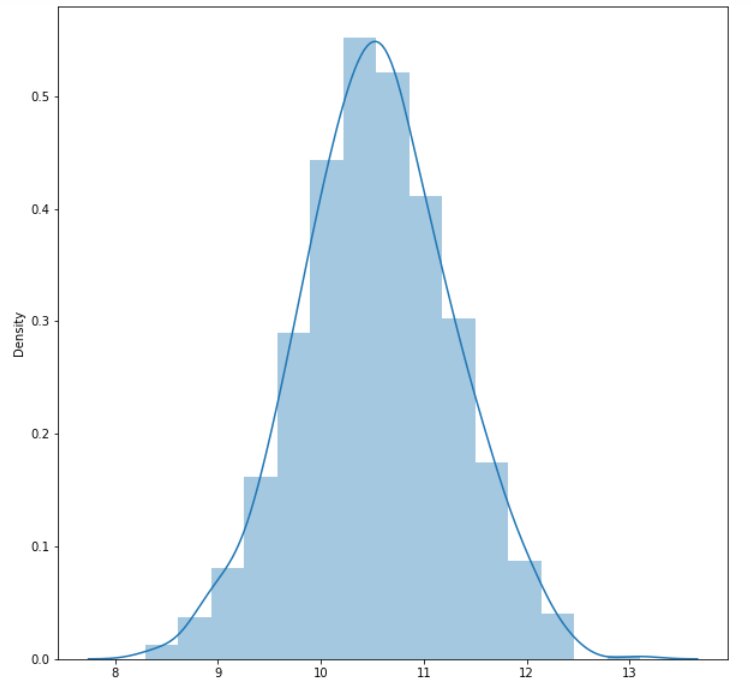
Let’s plot the normal distribution curve using CLT in Python
import numpy as np
import matplotlib.pyplot as plt
import seaborn as sns
# defining the sample size and number of samples we want to have
sample_size = 50
sample_number = 1000
sample_means = []
for i in range(0, sample_number):
    # randomly picking sample from the population distribution
    # In this case the population distribution is an Uniform distribution
    sample = np.random.uniform(1, 20, sample_size)
    sample_mean = sample.mean()
    sample_means.append(sample_mean)

plt.figure(figsize = (10, 10))
sns.distplot(sample_means, bins = 15);
Conclusion
In this article, we briefly explained CLT one of the most important and used theorem in statistics and data science.
Hope this article will help you in your data science and machine learning journey.
FAQs
What is Central Limit Theorem?
Central Limit theorem states that, if you have a population mean and standard deviation and takes large random samples from the population with replacement then he distribution of the sample mean will be approximately normally distributed regardless of whether the population is normal or skewed.
What are the assumptions behind the Central Limit Theorem?
1. Data must follow randomization condition. 2. Samples should be independent of each other. 3. 3. Sample size should be large but not be more than 10% of the population
When do we use Central Limit Theorem?
Central Limit Theorem is useful while analyzing the large dataset. It is advised not to use CLT if you have to find the probability of single or individual value.

Vikram has a Postgraduate degree in Applied Mathematics, with a keen interest in Data Science and Machine Learning. He has experience of 2+ years in content creation in Mathematics, Statistics, Data Science, and Mac... Read Full Bio


