Chi-Square Test: Definition and Example
Introduction
Chi-square test is a statistically significant test for Hypothesis Testing.
There are 3 steps in Hypothesis Testing:
- State Null and Alternate Hypothesis
- Perform Statistical Test
- Accept and reject the Null Hypothesis
In this article, we will discuss the Chi-square test.
Best-suited Statistics for Data Science courses for you
Learn Statistics for Data Science with these high-rated online courses
Table of Content
What is Chi-Square test?
Statistical method which is used to find the difference or correlation between the observed and expected categorical variables in the dataset.
Example: Food delivery company wants to find the relationship between gender, location and food choices of peoples India.
It is used to determine that the difference between 2 categorical variables are:
- Due to chance or
- Due to relationship
Mathematical Formula:
Types of Chi-square Test:
- goodness of fit test
- test for independence
Goodness of fit test:
- Number of variable = 1
- Used to determine, whether the variable(sample) belongs to population or not
- Degree of freedom:
To know more about sample and population and degree of freedom, read the article Basics of Statistics for Data Science and z-test
Example:
Problem Statement:
The observed and expected frequency of numbers appearing on dice.
Using chi-square test at 5% significance level determine whether,
Observed frequencies are different from expected frequency or not.
Solution:
Step-1: State Null and Alternate Hypothesis:
Null Hypothesis:
There is no difference between observed and expected frequency of outcome of rolling dice
Alternate Hypothesis:
There is a difference between observed and expected frequency of outcome of rolling dice
Step-2: Significance level and Degree of Freedom:
Significance level = 5%
Degree of Freedom = 6-1 = 5
Corresponding chi-square value = 11.07
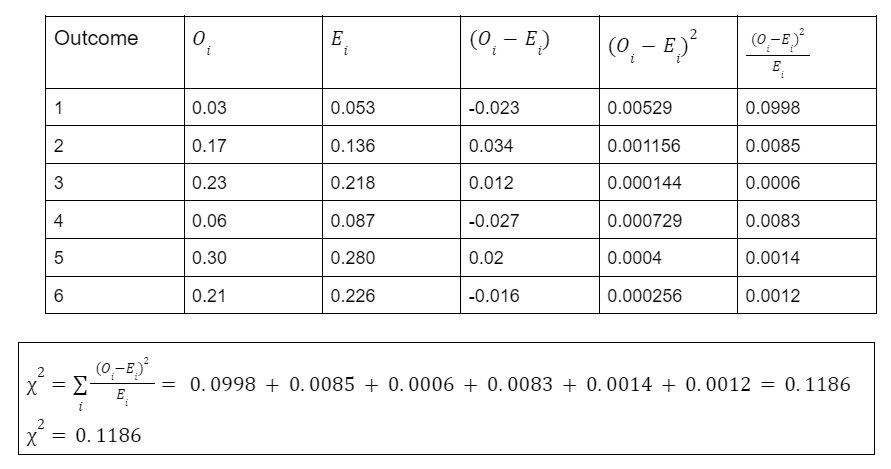
Step-3: Find the chi-square value:
Step-4: Comparing with the significance level:
From, step-2 and step – 3, we have:
0.1186 < 11.07
So, we have to accept the Null Hypothesis
There is no difference between observed and expected frequency of outcome of rolling dice.
Test for independence
- Number of variables = 2
- Used to determine, whether the variables are different or same
- Degree of Freedom:
Example:
Problem Statement: Election commission decides to find the relationship between Gender and casting vote.
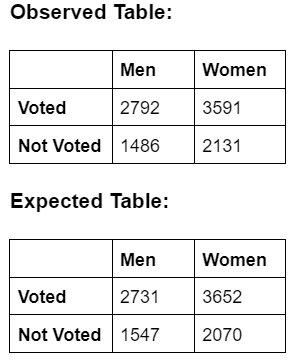
A sample of 10,000 people voters were taken, the result are summarized as:
Solution:
Step-1: State Null and Alternate Hypothesis
Null Hypothesis: Gender is independent of voting.
Alternate Hypothesis: Gender and Voting are independent.
Step-2: Significance level and Degree of Freedom
Significance level = 5%
Degree of Freedom = (2-1) x (2-1) = 1
Corresponding chi-square value = 3.84
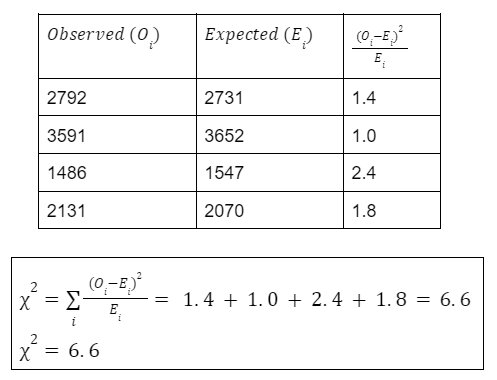
Step-3: Find the chi-square value
Step-4: Comparing with the significance level
From step-2 and step-3, we have,
6.6 > 3.84
Hence, rejecting the null hypothesis.
i.e. Gender and Voting are independent of each other.
Distribution Table:
| df | p = 0.75 | p = 0.90 | p = 0.95 | p = 0.975 | p = 0.99 |
| 1 | 1.32 | 2.71 | 3.84 | 5.02 | 6.64 |
| 2 | 2.77 | 4.60 | 5.99 | 7.37 | 9.21 |
| 3 | 4.10 | 6.24 | 7.80 | 9.33 | 11.31 |
| 4 | 5.38 | 7.77 | 9.48 | 11.14 | 13.27 |
| 5 | 6.62 | 9.23 | 11.07 | 12.83 | 15.08 |
| 6 | 7.84 | 10.64 | 12.59 | 14.44 | 16.81 |
| 7 | 9.04 | 12.02 | 14.07 | 16.01 | 18.48 |
| 8 | 10.22 | 13.36 | 15.51 | 17.54 | 20.09 |
| 9 | 11.39 | 14.68 | 16.92 | 19.02 | 21.67 |
| 10 | 12.5 | 15.9 | 18.3 | 20.5 | 23.2 |
| 11 | 13.7 | 17.3 | 19.7 | 21.9 | 24.7 |
| 12 | 14.8 | 18.6 | 21.0 | 23.3 | 26.2 |
| 13 | 16.0 | 19.8 | 22.4 | 24.7 | 27.7 |
| 14 | 17.1 | 21.1 | 23.7 | 26.1 | 29.1 |
| 15 | 18.2 | 22.3 | 25.0 | 27.5 | 30.6 |
| 16 | 19.4 | 23.5 | 26.3 | 28.8 | 32.0 |
| 17 | 20.5 | 24.8 | 27.6 | 30.2 | 33.4 |
| 18 | 21.6 | 26.0 | 28.9 | 31.5 | 34.8 |
| 19 | 22.7 | 27.2 | 30.1 | 32.9 | 36.2 |
| 20 | 23.8 | 28.4 | 31.4 | 34.2 | 37.6 |
Conclusion:
Chi-square is a statistically significant test for the hypothesis testing (null and alternative hypotheses) when the variables are categorical.
Top Trending Articles:Data Analyst Interview Questions Data Science Interview Questions Machine Learning Applications Big Data vs Machine Learning Data Scientist vs Data Analyst How to Become a Data Analyst Data Science vs. Big Data vs. Data Analytics What is Data Science What is a Data Scientist What is Data Analyst

Vikram has a Postgraduate degree in Applied Mathematics, with a keen interest in Data Science and Machine Learning. He has experience of 2+ years in content creation in Mathematics, Statistics, Data Science, and Mac... Read Full Bio


