Difference Between Covariance and Correlation
Looking to understand the difference between covariance and correlation? This article breaks down the key differences between the two statistical measures, including their definitions, range of values, units, sensitivity to scale, interpretation, and formulas. Gain a better understanding of how these measures are used and their impact on data analysis.
Covariance and Correlation are one of the most important concepts in probability. Covariance indicates the linear relationship between variables, whereas correlation measures the direction and strength of the linear relationship between variables. Using these you can quantify the relationship between variables and then use these to select, add, or remove the variable.
This article will discuss what is a Covariance, what is a correlation, and the difference between them.
Must Check: Free Statistics for Data Science Online Courses & Certifications
Must Check: Free Maths for Data Science Courses Online
So, without further delay let’s start.
Table of Content:
Best-suited Statistics for Data Science courses for you
Learn Statistics for Data Science with these high-rated online courses
What is the difference between Covariance and Correlation?
| Covariance | Correlation | |
| Definition | It measures how two variables vary from each other. | Measures the strength and direction between the linear relationship between two variables. |
| Range of Values | It can be between -inf and +inf. | It can range between -1 and 1. |
| Scalability | Sensitive to change in scale of variables. | Not sensitive to change in the scale of the variables. |
| Units | Depends on the unit of the variables | Unitless |
| Formula | cov(X, Y) = E[(X – E[X])(Y – E[Y])] | corr(X,Y) = cov(X,Y) / (std(X) * std(Y)) |


What is a Covariance?
Covariance signifies the direction of the linear relationship between two variables.
Here, direction means whether both random variables are direct proportionate (moves in same direction) or inversely proportionate (moves in opposite direction) to each other.
In Layman term covariance is nothing but a measure of variance between two variables. It can take any positive and negative value from -infinity to +infinity.
Mathematical Formula:
Covariance between two variables X and Y is calculated as:
Let’s calculate the covariance using Python:
#import libraryimport numpy as np #generating random datasetX = np.random.rand (15)Y = np.random.rand(15) #calculating the covariancenp.cov(X, Y) #np.cov(a,b) - it gives 2 x 2 matrix, that has elements cov(a,a), cov(a,b), cov(a, b), and cov(b,b).# note: cov (a,b) = cov(b,a)
Covariance is mainly classified into 3 parts:
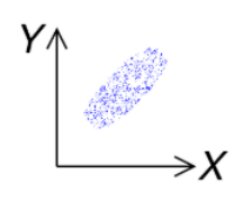
Positive Covariance:
- It indicates that two variable move in the same direction i.e. both are directly proportionate.
- COV(X,Y) > 0
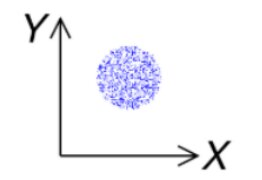
Zero Covariance:
- It indicates that there is no relationship between both the random variables.
- COV(X, Y) = 0
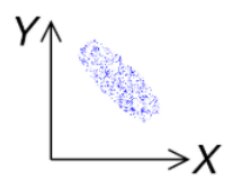
Negative Covariance:
- It indicates that two variable move in the opposite direction i.e. both are inversely proportionate.
- COV(X, Y) < 0
As covariance doesn’t signify the strength of the relationship between the random variable.
To overcome this problem, correlation comes into existence.


Correlation:
As similar to the covariance it also measures the relationship between two variables, as well as the strength betweenthese two variables.
It can take any values from -1 to 1.
Mainly correlation is represented by r.
Mathematical Formula:
Correlation of two random variable X and Y is given by:
Let’s calculate the correlation using Python:
#import libraryimport numpy as np #generating random datasetX = np.random.rand (15)Y = np.random.rand(15) #calculating the covariancenp.corrcoef(X, Y) #np.corrcoef(a,b) - which is a two-dimensional array with the correlation coefficients
Note: closer the value to 1 and -1, more closely two variables are related.
Correlation is mainly classified into 5 parts:
- Perfectly Positive
- r = 1
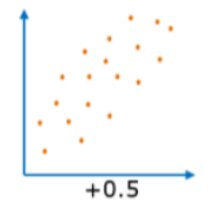
- Positive Correlation
- 0 < r < 1
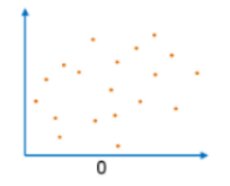
- No Correlation
- r = 0
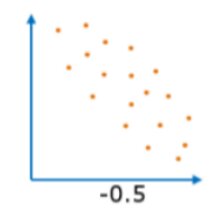
- Negative Correlation
- -1 < r < 0
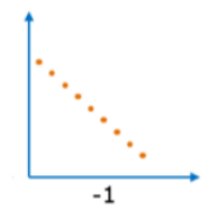
- Perfectly Negative Correlation
- r = -1


Types of Correlation:
What is Pearson Correlation?
- Normalized measurement of Covariance
- Assumes both the variables are normally distributed
- Measures linear relationship between two variables and fails to capture non-linear relationship
- It can be used for nominal or continuous variables
- Usually not used with the ordinal variable
Mathematical Formula for Pearson Correlation:
For any two random variable X and Y, Pearson correlation coefficient is calculated by:
Lets calculate the Pearson correlation coefficient using python:
#import libraryimport numpy as npfrom scipy.stats import pearsonr #pearsonr : pearson correlation coefficent (r) #generating random dataset such that both are normally distributedX = np.random.normal (size = 15)Y = np.random.normal(size = 15) #calculating the pearson correlation coefficient pearsonr(X, Y)


What is Spearman Rank Correlation?
- It is non-parametric measure
- Captures both linear and non-linear relationship
- Used for Ordinal variables or continuous variables
Mathematical Formula Spearman Rank Correlation:
For any two random variable X and Y, spearman rank correlation coefficient is calculated by:
Lets calculate the Spearman rank correlation coefficient using python:
#import libraryimport numpy as npfrom scipy.stats import spearmanr #spearmanr : spearman correlation coefficent (r) #generating random dataset X = np.random.rand (15)Y = np.random.rand(15) #calculating the spearman rank correlation coefficient spearmanr(X, Y)
What is Kendall Rank/Kendall Tau Correlation?
- Non-parametric measure for calculating the rank correlation coefficient
- Used for ordinal variables
- Captures both linear and non-linear relationship
Mathematical Formula Kendall Tau Correlation:
For any two random variable X and Y, Kendall rank correlation coefficient is calculated by:
Concordant Pair: A pair is concordant if the observed rank is higher on one variable and is also higher on another variable.
Discordant Pair: A pair is discordant if the observed rank is higher on one variable and is lower on the other variable.
Let’s calculate the Pearson correlation coefficient using python:
#import libraryimport numpy as npfrom scipy.stats import kendalltau #generating random dataset X = np.random.rand (15)Y = np.random.rand(15) #calculating the kendall rank correlation coefficient kendalltau(X, Y)
Conclusion
In this article, we have briefly discussed what is correlation, what is covariance, and the key differences between them. The article also covers the different types of covariance and correlation and the corresponding examples.
Hope this article will help you in data science and machine learning journey.
Happy Learning!!
Articles You May Be Interested in


FAQs
What is a Covariance?
Covariance is a statistical measure that indicates the degree to which two variables tend to vary together.
What is a Correlation?
Correlation is a statistical measure that indicates the strength and direction of the linear relationship between two variables.
What are the different types of Correlation used in Data Science?
There are mainly three different types of Correlation: Pearson Correlation, Spearman Correlation, and Kendall Rank or Kendall Tau Correlation.
What are the different types of Covariance?
There are three different types of covariance: Positive Covariance: It indicates that two variable move in the same direction i.e., both are directly proportionate. Zero Covariance: It indicates that there is no relationship between both the random variables. Negative Covariance: It indicates that two variable moves in the opposite direction i.e., both are inversely proportionate.


