How to Connect Power BI to a SQL Server Database?
Microsoft Power BI is a powerful business intelligence tool that supports a variety of data sources with SQL Server Database being one. In this article, let us explore the various ways to connect SQL Server Database with Power BI.
In this article, we will discuss two methods to connect Power BI to a SQL Server Database. Let’s have a look:
Method 1: Using SQL Server Database Connector
Connecting Power BI to an SQL server basically means importing the data from the required dataset from an SQL Server to Power BI. To make the connection, execute the following steps:
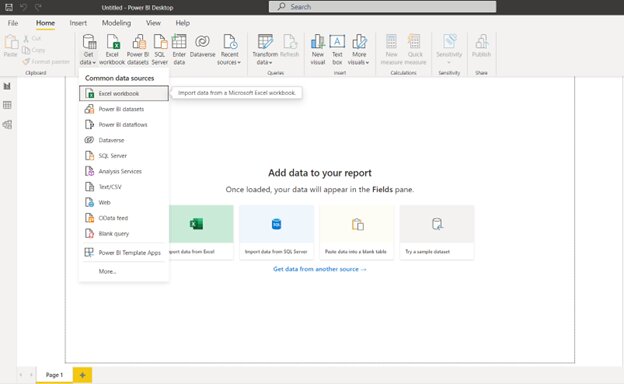
Step1: In the Power BI Desktop, click on Get Data > More.
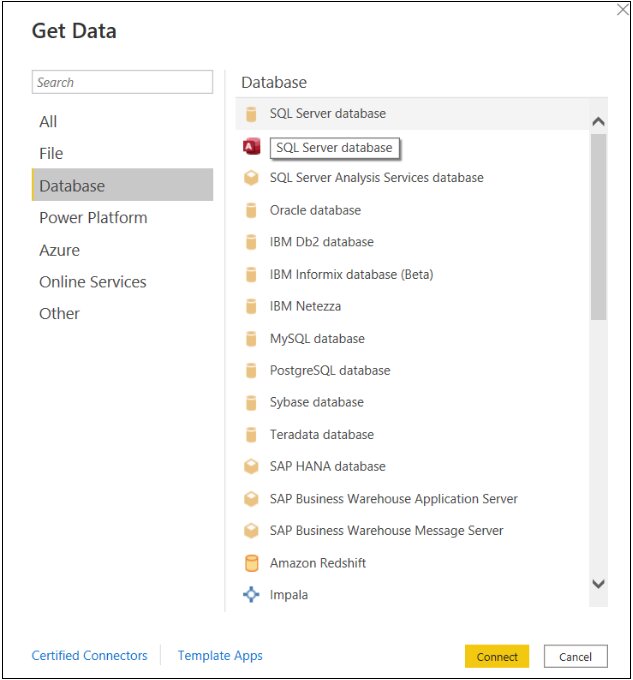
In the dialog box that opens, go to Database > SQL Server Database. Then click on Connect.
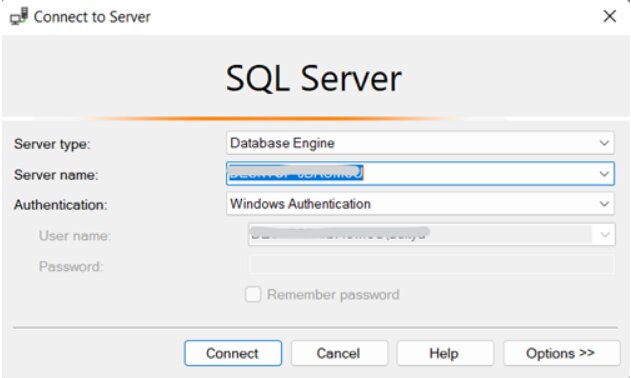
Step2: In the SQL Database dialog box that appears, enter the name of the server and the database name that you want to access from the database. In case you do not provide the database name, all the databases on your server will be loaded.
Then, you can select the data connectivity mode of your choice: Import or DirectQuery. In this demo, let us go with the Import option. For your information, import mode will import a copy of the data into the Power BI cache, whereas PowerQuery mode lets you connect directly to data.
You can also provide additional SQL statements and connection timeout under the advanced options.
Note: Server name is nothing but the name that you give when trying to connect with the Microsoft SQL Server Management Studio.
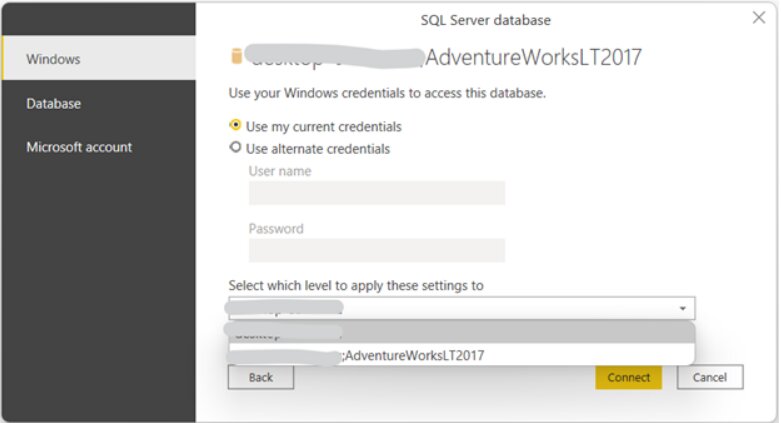
Step3: If you are connecting to the database for the first time, Power BI will prompt you to select the authentication type, fill in the credentials, and select the level to which the authentication settings should apply.
Since I am trying to connect to the database on my local system, I will choose the “Use my current credentials” option.
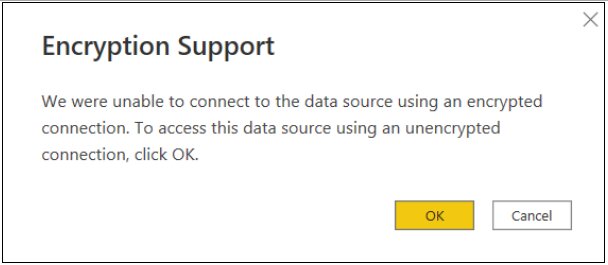
If the connection is not encrypted the following dialog box will pop up.
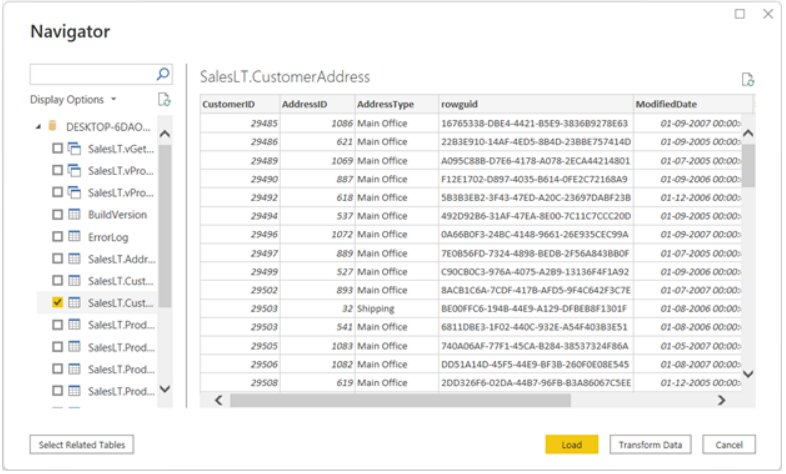
Step4: In the navigation pane that appears, select the table(s) that you want to analyze and visualize and then click on Load (or Transform)
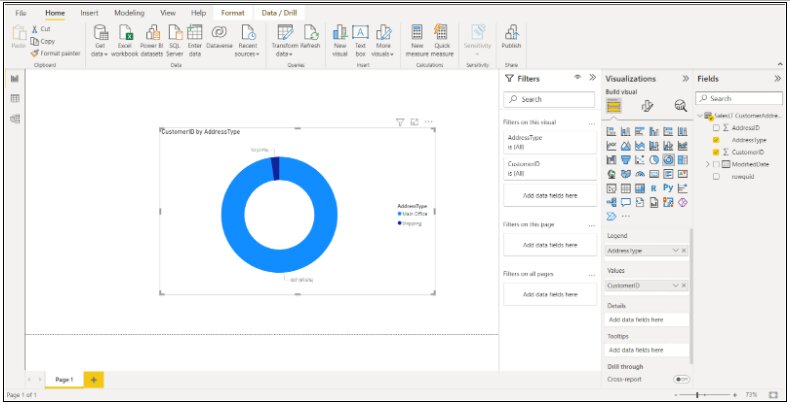
Step5: Once your data is ready, it will appear under the ‘Fields’ pane of your Power BI Desktop. You can then start visualizing the data according to your requirement.
Method 2: Using Python Script
You can also connect to SQL Server Database using Python or R scripts. Let us see how to achieve that using the Python script in this example.
Step1: The first step is to install Python and a few required libraries.
pip install pyodbc pip install pandas pip install matplotlib
You can install these libraries in the command prompt.
Step2: Check if Python scripting is enabled on Power BI Desktop. To do that go to File > Options and Settings > Options. In the dialog box that opens, navigate to Python scripting. Make sure “Python Home Directory” points to the Python installation path. You can also choose the IDE on which the Python script will be installed.
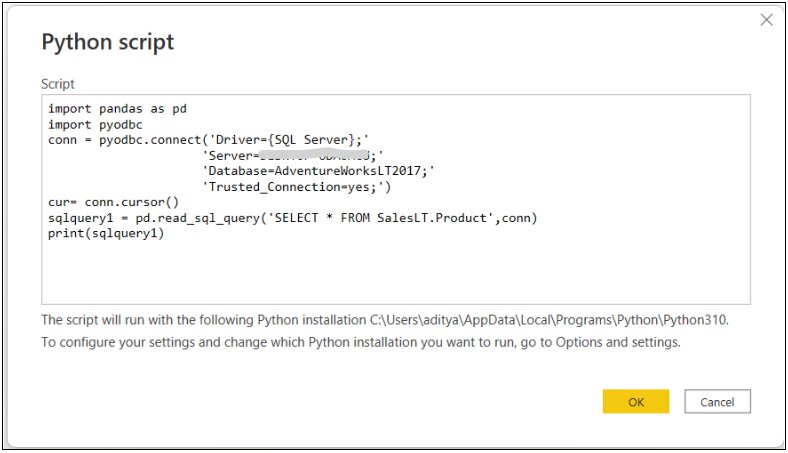
Step3: Go to Power BI desktop Home, click on Get Data > More > Others. Select Python script and enter the script given below in the dialog box that opens.
Here’s the Python script.
import pandas as pd

import pyodbc

conn = pyodbc.connect('Driver={SQL Server};'

                     'Server=yourservername;'

                     'Database=databasename;'

                     'Trusted_Connection=yes;')

cur= conn.cursor()

sqlquery1 = pd.read_sql_query('SELECT * FROM tablename',conn)

print(sqlquery)
Place server name, database name, and the required table name at relevant places in the script. You can modify the SQL query based on your requirement. Then click on OK.
Step4: In the navigation pane that appears, select the table that you want to analyze and visualize and then click on Load (or Transform). Please note that the name of the table will be the SQL query variable that you would have used in the script. In this case “sqlquery1”.
Step 5: Once your data is ready, it will appear under the ‘Fields’ pane of your Power BI Desktop. You can then start visualizing the data according to your requirement.
That’s it! Thanks for reading. I hope this article cleared your doubts on how to connect Power BI to SQL Server Database.
If you want to learn more about Power BI, you can refer to these articles:


Top Trending Tech Articles:
Career Opportunities after BTech | Online Python Compiler | What is Coding | Queue Data Structure | Top Programming Language | Trending DevOps Tools | Highest Paid IT Jobs | Most In Demand IT Skills | Networking Interview Questions | Features of Java | Basic Linux Commands | Amazon Interview Questions
Recently completed any professional course/certification from the market? Tell us what liked or disliked in the course for more curated content.
Click here to submit its review with Shiksha Online.
This is a collection of insightful articles from domain experts in the fields of Cloud Computing, DevOps, AWS, Data Science, Machine Learning, AI, and Natural Language Processing. The range of topics caters to upski... Read Full Bio


