Learn these Business Intelligence tools to Level-up Your Analytics Skills
A majority of analytics work is about basic data exploration and it isn’t just about algorithms. For most managers, the ability to explore and analyze data for reporting can directly help in improved performance at work. Instead of taking up programming, a faster way is to master the business intelligence tools and plug in your data into it. Here we have listed the top 5 business intelligence tools that you can learn and master.
1. Tableau
Tableau is among the most popular business intelligence tools globally used in data visualization. It has some brilliant features, including drag and drop interface, which helps to efficiently perform tasks like sorting, comparing, and analyzing, in a very short time. Tableau leverages visual analytics enabling users to interact with data and thereby helping them to get insights in less time and make critical business decisions in real-time.
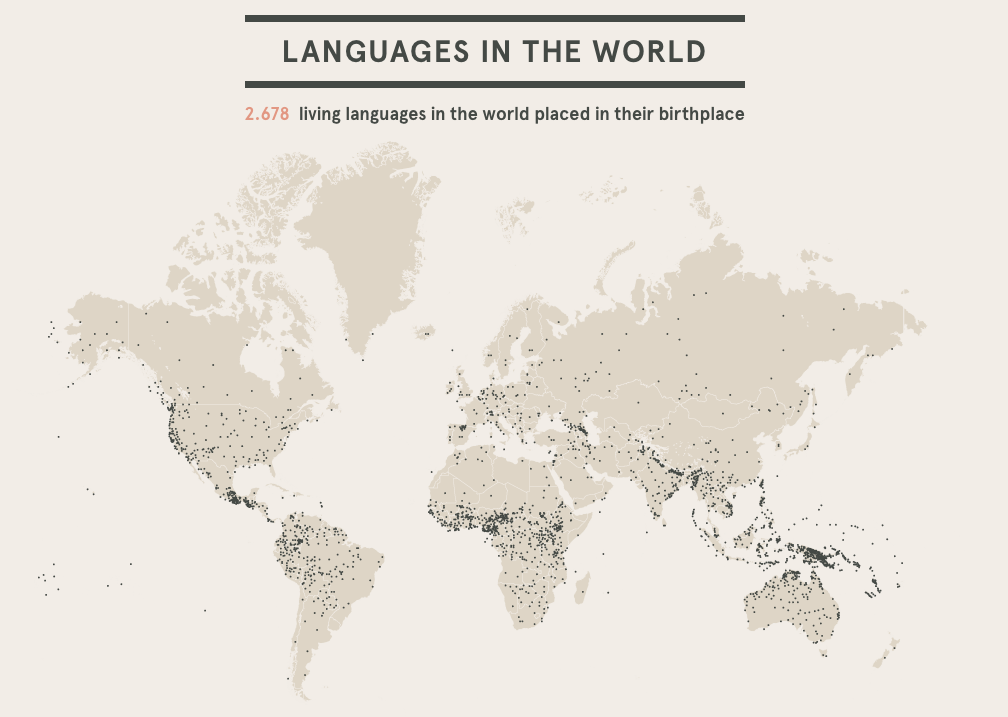
Tableau is also compatible with multiple sources, including MS Excel, SQL Server, and cloud-based data repositories, making it a popular data analytics and visualization tool. See a simple example of how Tableau can help you in presenting your data effectively. This below example depicts the origin of various languages across the globe.

Image Source – help.tableau
Features of Tableau
- Dashboard commenting
- Translate queries to visualizations
- Import data of all ranges and sizes
- Create interactive dashboards
- Tableau Public for data sharing
- Share dashboards
- Security permissions at every level
Cost
$70/user/month, billed annually
Limitations
- Conditional formatting and limited to 16 column table displays
- Costly
- Poor after-sales support
Enhance your knowledge of Tableau with this course.
2. Google Charts
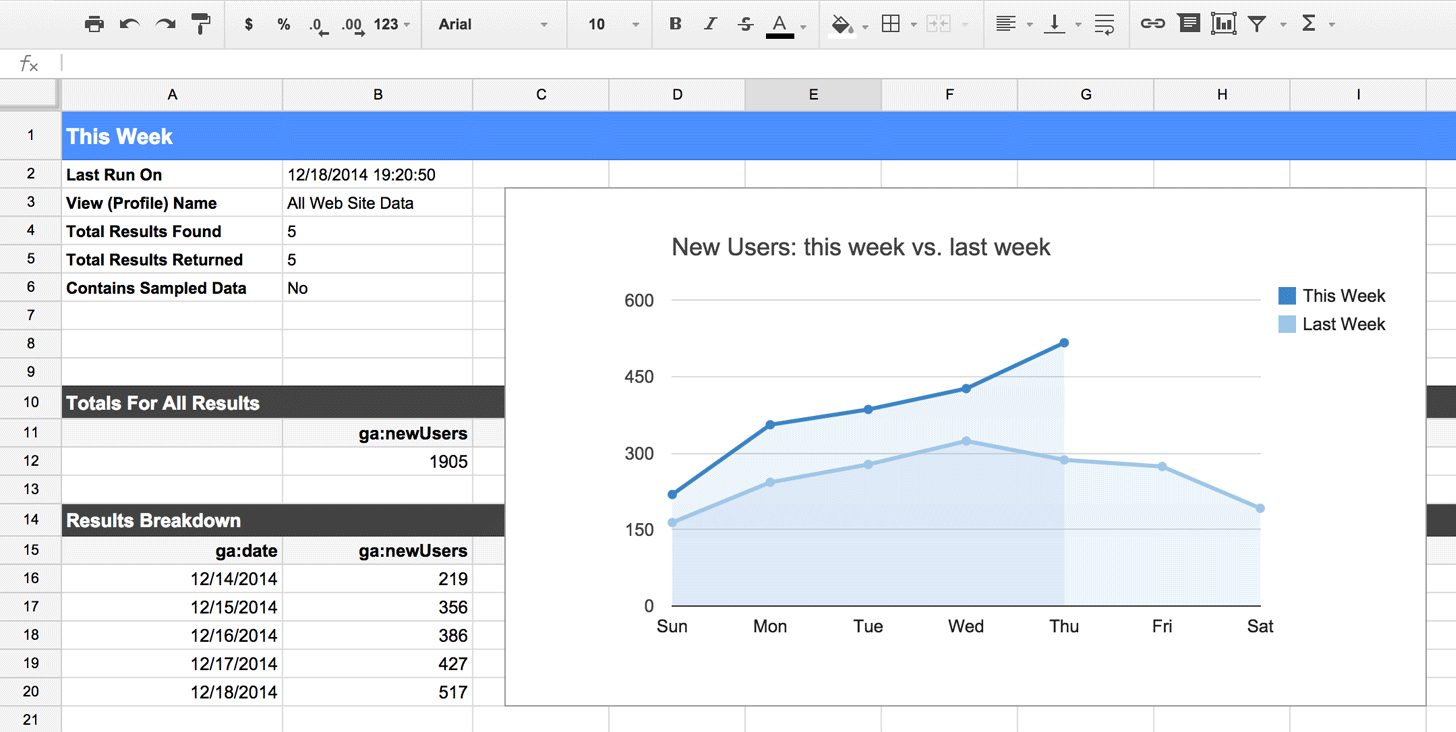
Google Charts is a popular visualization tool because of its cost-effectiveness and impressive functionalities. It allows the users to present data on their website using some simple yet exciting visualizations. It can be used with simple JavaScript that users can embed in their web pages and create a wide variety of charts for their website. You may understand it better with an example of Google Charts that presents weekly sampling results of a company.
Image Source – developers.google
Features of Google Charts
- Overlays
- Word Trees
- Development Tools
- Timelines, Trendlines & Animation
- Chart Editor
- Controls and Dashboards
- Crosshairs
- Lines, Data Tables, Data Views, Formatters
- Cross-browser compatibility
- Chart Gallery & Events
Cost
Free!
Limitations
- Requires a continuous network connection to use
- Not as detailed as other data visualization tools
- Fewer functionalities
3. Power BI
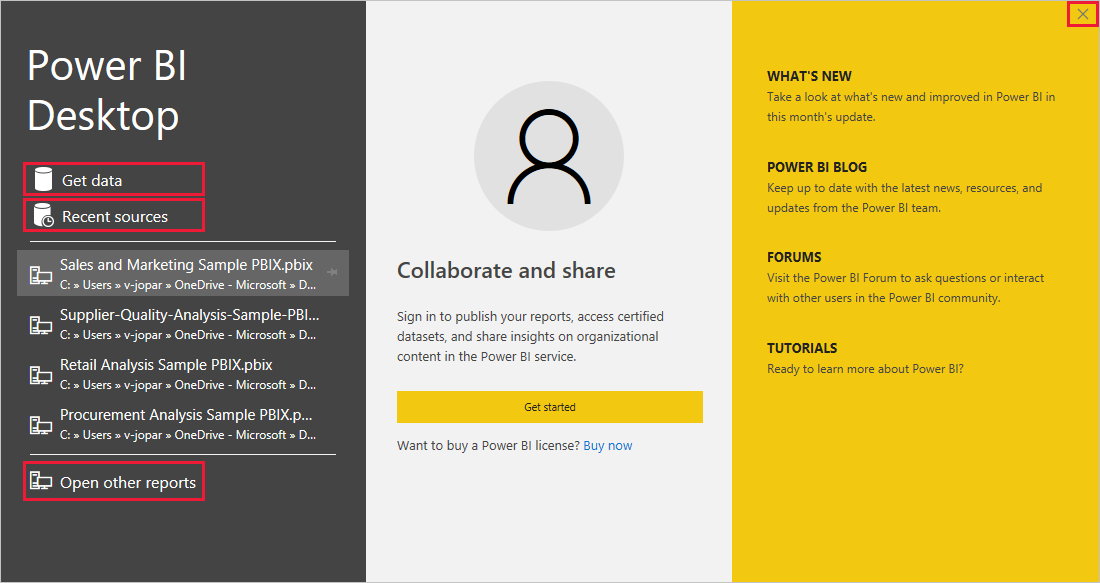
Power BI is another very popular business analytics and data visualization solution by Microsoft that enables you to visualize your data and share insights across your organization. You can also embed them in your app or website. Power BI allows you to be productive and creative with the reports and analytics. You can churn out useful information from your data and create visual-reports through the below process –
- Connecting to your data
- Preformatting of data
- Modelling of data
- Data visualization
- Publishing data reports
- Power BI Interface
Image Source – docs.microsoft
Features
- Quick Insights
- Ask a Question
- Integration with R
- Intelligent App Suggestions.
- Integration of Azure Machine Learning
- Data Shaping with R:
- Segmentation & Cohort analysis
- Data Analysis Expression
- Integration with Microsoft Azure Stream Analytics
- Data Visualization in Power BI
Cost –
- Power BI Pro – $9.99 monthly price per user
- Power BI Premium – $4,995 monthly price per dedicated cloud compute and storage resource with an annual subscription
Limitations
- Rigid Formulas
- Ingests limited data
- Unconfigurable custom visuals
4. Zoho Analytics
Zoho Analytics is among the most popular business intelligence tools that can help you in creating attractive data visualizations very shortly. This platform enables you to collect data from multiple resources and create multidimensional data visualizations. To help you with, there is also a smart artificial intelligence tool for your assistance, named Zia. Zoho Analytics facilitates data sharing and user engagement. The data from the platform can be exported in any format such as Spreadsheet, MS Word, Excel, PPT, PDF, etc.
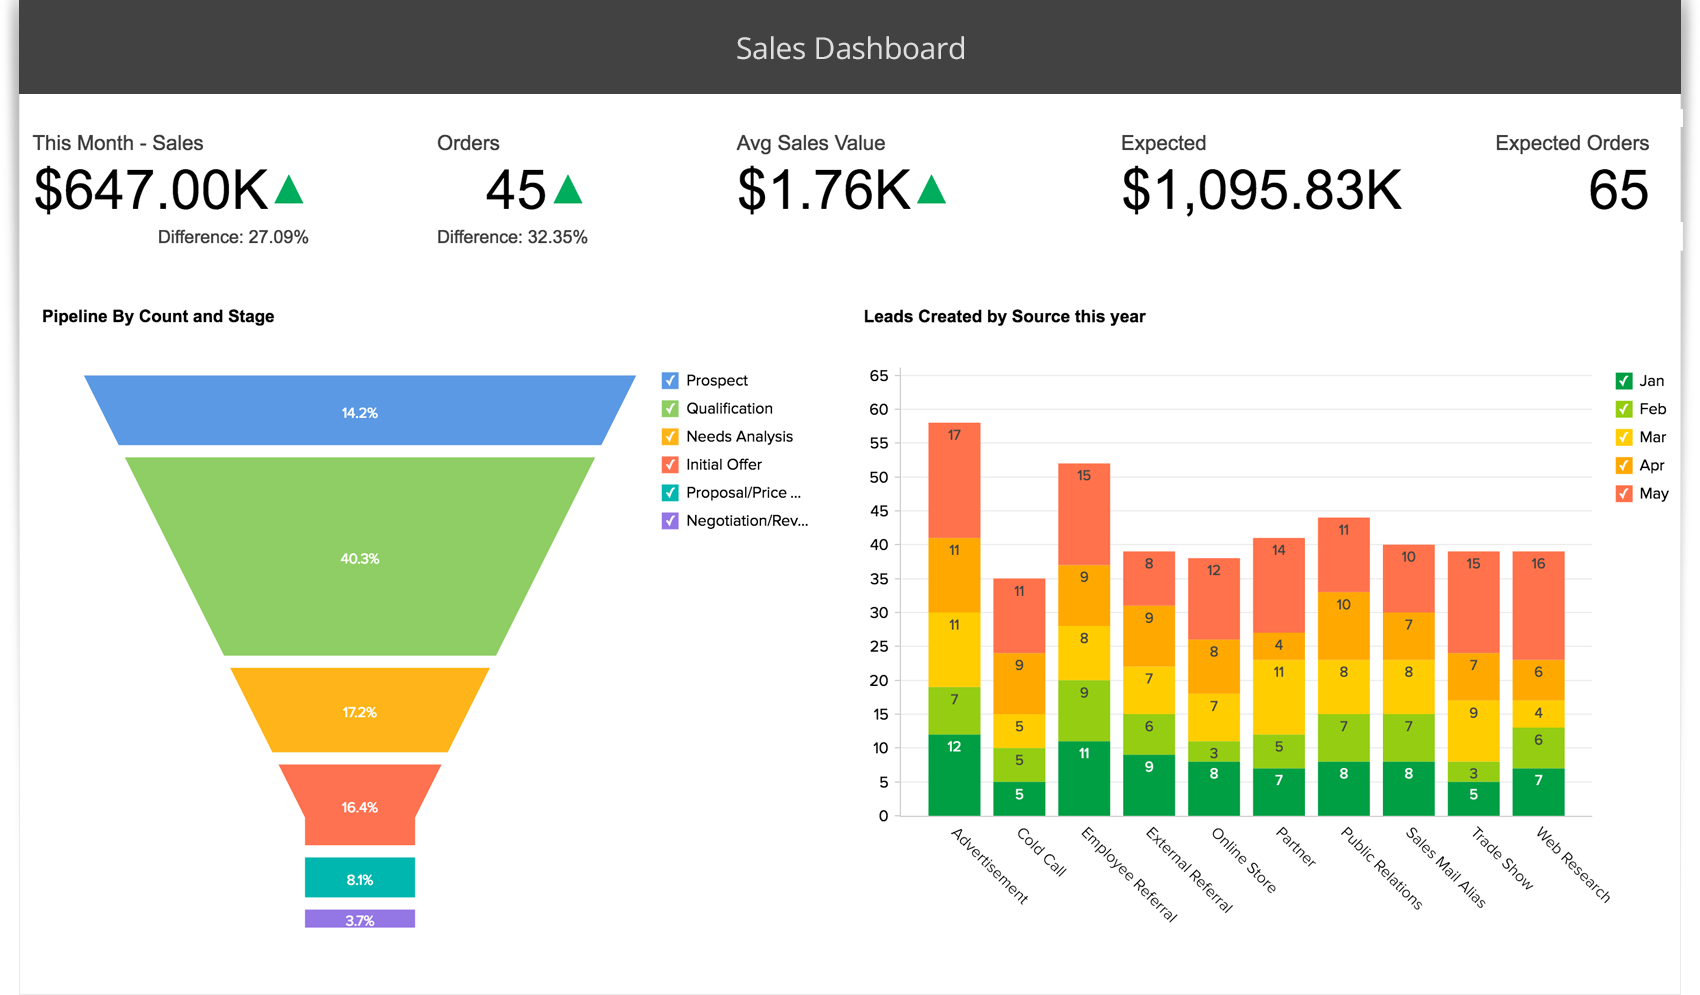
Here is a sample of Zoho Analytics visualization dashboard to help you understand the tool better –
Image Source – Zoho
Features
- Create reports over multiple tables using auto-join
- Automated analytics
- Quickly generate similar reports
- Scheduled data backup
- Drag-and-drop interface
- Query tables
- Large screen display & Slideshow
- REST API
- Multi-language support
- Streamlined data gathering
- Optimized pivot tables
- Simplified chart creation
Costs
- 3-day FREE Assist Program – Free
- Basic – ₹875/month
- Standard – ₹1,750/month
- Premium – ₹4,000/month
- Enterprise – ₹15,250/month
- Additional Users: ₹250 /user/month
Limitations
- Inability to integrate with a variety of platforms
- Doesn´t allow users to access data from outside
- Pay for each Zoho tool separately
5. Qlik Sense
Qlik Sense is a modern and interactive user interface solution from Qlik. It offers access to highly interactive guided analytics applications and dashboards, to deliver actionable business insights. QlikView mainly focuses on analytics and statistics that connect to databases to provide a more holistic view for analysts and business managers to inform data-supported decisions. It is a very user-friendly tool that enables the use of tools for modelling and managing data, creating visualizations, layouts, and stories.
You can manually apply colors to your visualizations using the following methods:
- Color by single color
- Color by multiple colors
- Color by dimension
- Color by measure
- Color by expression
You can go through the executive dashboard of Qlik Sense below to have a quick understanding of the tool.
Image Source – help.qlik
Features
- Smart visualizations and analytics
- Self- service creation
- Centralized sharing and collaboration
- Data storytelling and reporting
- Embedded analytics, custom applications, and extensions
- Data preparation and integration
- Smart search options
- Fast and reliable connections to multiple data sources
- Drag and drop visualizations
- Generate personalized reports
- Self-service data discovery
Costs
Qlik Sense® Business – $30/user/month
Qlik Sense® Enterprise –
Professional – $70/user/month
Analyzer – $40/user/month
Limitations
- High memory usage, leading to slow functions
- Issues in loading data in the script or data load editor
- Cannot use version control software on Qlik Sense files
In a Nutshell
An indispensable part of data analytics; data visualization and business intelligence have found their way in every business. The usage of business intelligence is likely to expand exponentially in all the major corporations globally. Consider learning more about these tools and harness data visualization in unique and profitable ways.
Most of these business intelligence tools include free trials, it’s worth taking the time to try out a few before finalizing one!
If you have recently completed a professional course/certification, click here to submit a review.

Rashmi is a postgraduate in Biotechnology with a flair for research-oriented work and has an experience of over 13 years in content creation and social media handling. She has a diversified writing portfolio and aim... Read Full Bio


