Measures of Central Tendency: Mean, Median and Mode
When we have the dataset having ample records (like passenger traveling through of airplane, weight, and score of all students in a university, share prices) in it and we have to analyze the dataset. We first lookup for the summary of the dataset like the characteristics of all the features(variables).
A large number of records in the dataset tends to Center around a single value. As these values represent the location of the Central value of the dataset, they are called Measure of Central Tendency.
Table of Content:
Best-suited Statistics for Data Science courses for you
Learn Statistics for Data Science with these high-rated online courses
What is Measure of Central Tendency?
A measure of central tendency is a summary measure that attempts to describe a whole set of data with a single value that represents the middle or center of its distribution.
The three most common measures of central tendency are:
- Mean (Arithmetic Mean)
- Median
- Mode
What is Mean?
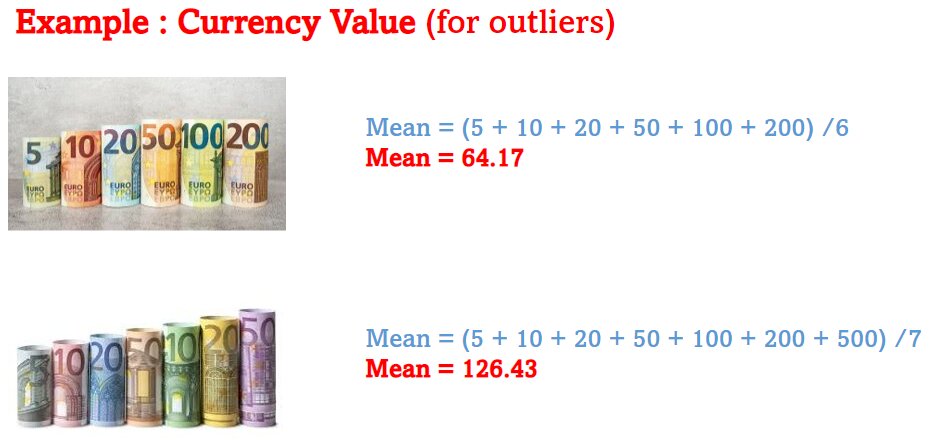
Arithmetic Mean is the sum of observation divided by the number of observations.
- Rigidly defined
- Based upon all the observations
If we have n observations x1, x2, x3,……,xn, then
Limitation of Mean:
- Can’t be used for Categorical Data
- Affected by outliers
What is Median?
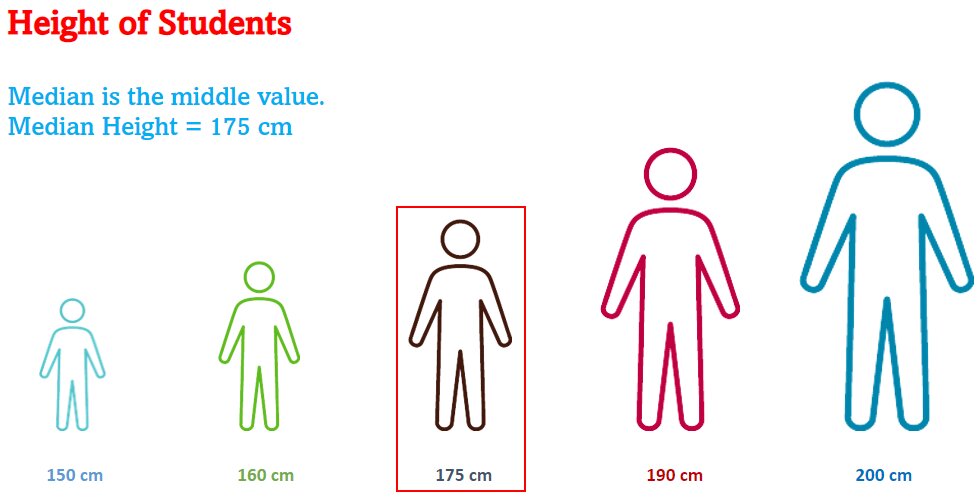
The median of a distribution is the value of the variable which divides it into two equal parts when the data is orderly arranged (either in ascending or descending order).
- Not affected by outliers
- Used in categorical data as well
If we have n number of observations x1, x2, x3,……xn, then:
Case-1: when n is odd
Case – 2: when n is even
Limitations of Median:
- Less representative as doesn’t depend on all observations
- Not amenable to algebraic treatment
- Observation has to be orderly arranged
What is Mode?
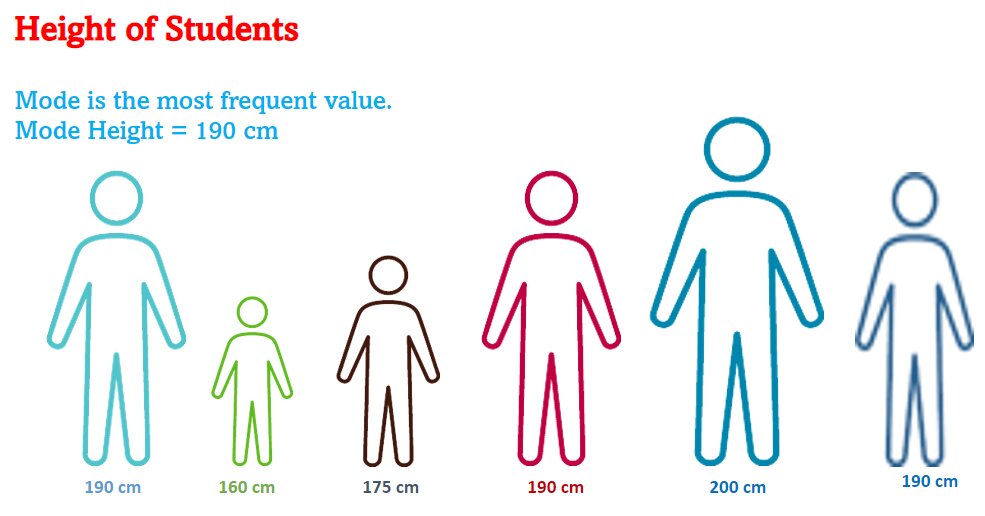
Mode is the observation that occurs most frequently in a dataset and around which the other observations of the dataset are clustered densely.
- Not affected by outliers
- Used for both categorical and numerical data
Limitation of Mode:
- Not well defined
- Less representative as doesn’t depend on all observations
- No or multiple modes
All the three measures Mean, Median and Mode are connected by Empirical Relationship
2Mean + Median = 3Mode
Distribution and Central Tendency
A dataset distribution is a collection of n number of observations. They are broadly classified into:
- Normal
- Skewed
Normal Distribution:
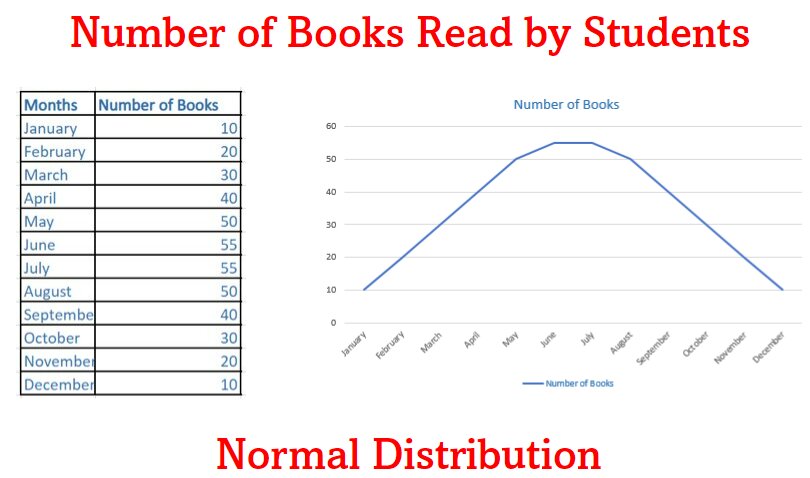
In a normal distribution, all the observations of the dataset are symmetrically distributed about the mean. Most of the values are clustered around the central region.
In normal distribution:
Mean = Median = Mode
Skewed Distribution:
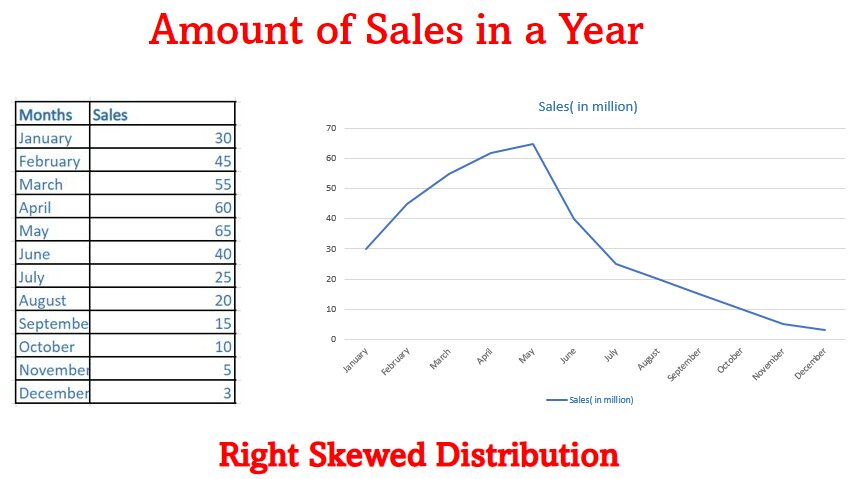
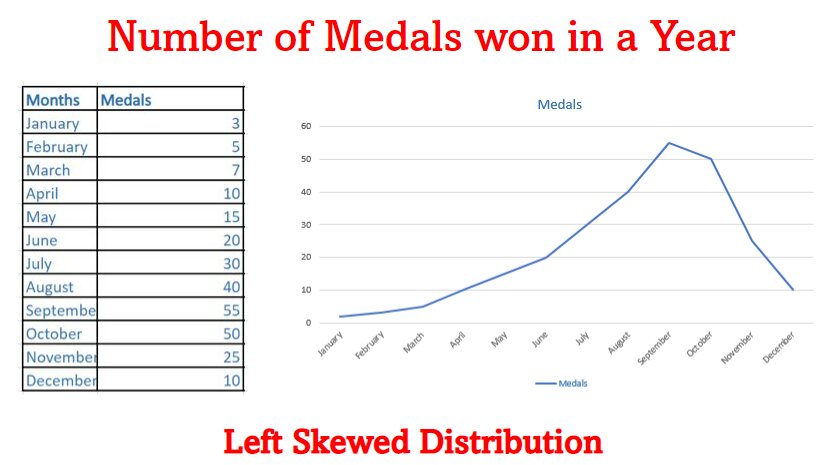
In a skewed distribution, most of the observations are distributed on one side(either left or right) and the other side will have a long tail.
- Right Skew: In positive skew, most of the observations are on the left sides and spread out the tail on the right side, that is why they are also known as Right Skewed Distribution.
- In positive skew:
Mean > Median > Mode
- Left Skew: In positive skew, most of the observations are on the right sides and spread out the tail on the left side, that is why they are also known as Left Skewed Distribution.
- In positive skew:
Mean < Median < Mode
Conclusion:
The central tendency of distribution represents one characteristic of a distribution. In this article, we cover an in-depth description of Measures of Central tendency with its limitations using simple examples.
————————————————————————————————————–
If you have recently completed a professional course/certification, click here to submit a review.
Top Trending Articles in Statistics:
Skewness In Statistics | Statistics Interview Question | Basics Of Statistics | Measure Of Central Tendency | Probability Distribution | Inferential Statistics | Measure Of Dispersion | Introduction To Probability | Bayes Theorem | P-Value | Z-Test | T-Test | Chi-Square Test | Outliers In Python | Sampling and Resampling | Regression Analysis In Machine Learning | Gradient Descent | Normal Distribution | Poisson Distribution | Binomial Distribution | Covariance And Correlation | Conditional Probability | Central Limit Theorem
FAQs
What is Measure of Central Tendency?
A measure of central tendency is a summary measure that attempts to describe a whole set of data with a single value that represents the middle or center of its distribution. The three most common measures of central tendency are: 1. Mean (Arithmetic Mean) 2. Median 3. Mode.
Which is the best measure of central tendency - Mean, Median, mode?
There is no best measure, it all depends on the type of distribution or type of data a. Mean is best for non-skewed distribution and Nominal data. b. Median is best for skew as well as non-skewed distribution. c. Mode is the only central measure used for nominal data.
What is the relation between mean, median, and mode in Normal and Skewed Distribution?
1. Normal Distribution: Mean = Median = Mode 2. Right Skew Distribution : Mean > Median > Mode 3. Left Skew Distribution : Mean < Median < Mode


