Understand the Basics of P-value
Discover what p-value means in statistics, why it’s important for scientific research, and how to interpret its results correctly. Learn how to avoid common misconceptions and pitfalls and improve your understanding of hypothesis testing and statistical inference.
Introduction:
p-value, is the most important concept used in data science, but still, the most confusing one to understand.
If you ask questions:
Who knows p-value, everyone will say yes.
Who can explain the p-value?
The answer is quite a few.
So, in this article, we will try to explain this mystery.
Best-suited Statistics for Data Science courses for you
Learn Statistics for Data Science with these high-rated online courses
Table of Content:
What is the p-value?
P-value is the probability that a random chance generated the data or something else that is equal or rare.
The first question that arises here is:
Are probability and p-value the same?
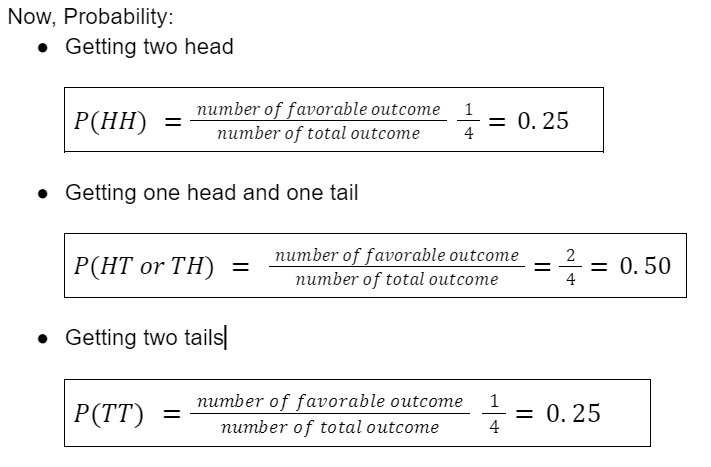
Let’s understand the difference by an example of tossing two coins:
To know about probability, read the article on Probability.
Divide the definition into 3 parts, to get a better understanding of the p-value
- Is the probability that a random chance generated the data?
- Is the probability of something else that is equal?
- Is the probability of something else that Rare (not found in large numbers and so of interest or value)?
Problem Statement: What is the probability and p-value of getting two tails in a row?
Solution: Sample space of tossing two coins
S = {HH, HT, TH, TT}
Now, for p-value:
- Probability that a random chance generate the data = P(TT) = 0.25
- Probability of something
- that is equal = P(HH) = 0.25
- that is rare = 0
Hence, the p-value (TT) = 0.25 + 0.25 + 0 = 0.50, while the P(TT) = 0.25
Let’s take another example of tossing 4 coins:
Problem Statement: What is the p-value of getting 4 tails in a row.
Solution: Sample Space of tossing 4 coins:
S = {HHHH, HHHT, HHTH, HTHH, THHH, HHTT, HTHT, THHT, THTH, TTHH, HTTH, TTTH, TTHT, THTT, HTTT, TTTT }
Now, firstly we will find some probability,
Now,
- Probability that a random chance generate the data = P (TTTT) = 0.0625
- Probability of something
- that is equal = P (HHHH) = 0.0625
- that is rare = P (HHHT, HHTH, HTHH, THHH) +P (TTTH, TTHT, THTT, HTTT) = 0.25 + 0.25 = 0.50
Hence, p-value (TTTT) = 0.0625 + 0.0625 +0.50 = 0.625
Note:
The p-value is a proportion: if your p-value is 0.05, that means that 5% of the time you would see a test statistic at least as extreme as the one you found if the null hypothesis was true.
Significance Level (alpha-value):
Alpha value is also known as the significance level.
It is nothing but a threshold p-value, which is decided by the group conducting the experiment before using any statistical test like (z-test or t-test).
The alpha value represents the acceptable probability of Type-1 error.
The most commonly used alpha values are 0.01, 0.05, and 0.1, it represents 1%, 5%, and 10% chance of type-1 error.
Note: 0.05 is mainly used in Hypothesis testing.
Role of p-value in hypothesis testing:
P-values are used in hypothesis testing to decide whether to reject the null hypothesis or not.
- p – value < alpha – value
Means results are not in favor of the null hypothesis, reject the null hypothesis
- p-value > alpha – value
Means results are in favor of the null hypothesis, accept the null hypothesis
To know about hypothesis testing, null and alternate hypotheses, read the article on Introduction to Inferential Statistics.
Let’s understand the role of p-value in hypothesis testing by an example:
Problem Statement:
Blood glucose levels for obese patients have a mean of 74 with a standard deviation of 8. A researcher thinks that a diet high in raw cornstarch will have a positive or negative effect on blood glucose levels.
A sample of 60 patients who have tried the raw cornstarch diet has a mean glucose level of 78.
Test the hypothesis that raw cornstarch had an effect.
Solution:
Step -1: Given Information
Population mean = 74
Population Standard Deviation = 8
Sample Size = 60
Sample Mean = 78
Step -2: Setup Null and Alternate Hypothesis
Consider
Null hypothesis: the mean glucose level is 74
Alternate hypothesis: the mean glucose level is not 74
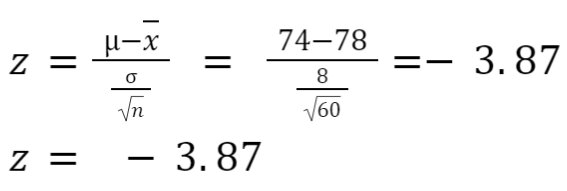
Step – 3: Calculating z-score, and finding p-value
As the sample size is greater than 30, we will use a z-test here,
So, substituting the value in the above formula, we get:
Now if we look the z-table for -3.87, we will get the value ~0.999.
For this calculation, we will use the fact that the total area under the normal z-distribution is 1.
So, the area to the right of z-score can be calculated as:
P-value = 1-0.999 = 0.001.
Step-4: Comparing p and alpha value:
As we were not given any value for alpha, assume alpha = 0.05
So, we have 0.001 < 0.05
i.e. P-value < alpha value
Therefore, we have to reject the null hypothesis.
Conclusion
In this article we try to explain one of the most complicated concepts of data science i.e. p-value.
Hope this article will help you to get the better understanding of this.
FAQs
What is a p-value?
A p-value is a statistical measure that helps determine the likelihood of observing a certain outcome, assuming that a null hypothesis is true.
What is a Null Hypothesis?
The null hypothesis is the hypothesis that there is no statistically significant difference between the two groups being compared in a study.
What is an Alternate Hypothesis?
alternative hypothesis, is a hypothesis that contradicts the null hypothesis in a statistical analysis. It is a statement that there is a significant difference or relationship between two variables being studied, and it is usually represented by the symbol Ha.
What is a Type-1 Error and Type-2 Error?
Type-1 Error: A type I error occurs when the null hypothesis is rejected, but it is actually true. This is also known as a false positive. Type-2 Error: A type II error occurs when the null hypothesis is accepted, but it is actually false. This is also known as a false negative.
How is the p-value used in Hypothesis Testing?
In hypothesis testing, the p-value is compared to the significance level to determine whether the null hypothesis should be rejected or not.
What are the limitations of Hypothesis Testing?
Limitations of p-value: 1. P-values do not measure effect size 2. P-values are influenced by sample size 3. P-values are influenced by multiple comparisons 4. P-values do not provide evidence for the null hypothesis. 5. P-values do not prove causation

Vikram has a Postgraduate degree in Applied Mathematics, with a keen interest in Data Science and Machine Learning. He has experience of 2+ years in content creation in Mathematics, Statistics, Data Science, and Mac... Read Full Bio


