Probability Distributions used in Data Science
In this article we listed 5 probability distributions used in Data Science like Uniform, Bernoulli, Binomial, Poisson, and Normal which are .
Introduction:
Probability is defined as the likeliness of something to occur or happen and probability distributions are functions that give the relation between all the outcomes of a random variable in any random experiment and its probable values.
These distribution functions are used in predicting the stock prices, weather prediction.
In this article, we have listed the 5 most used Probability Distributions in Data Science.
Best-suited Statistics for Data Science courses for you
Learn Statistics for Data Science with these high-rated online courses
Table of Contents
What is Random Variable?
Set of all possible values from a Random Experiment is called Random Variable.
It is represented by X.
Example: Outcome of coin toss
Types of Random Variable:
-
Discrete Random Variable
-
-
- X is a discrete because it has a countable values between two numbers
- Example : number of balls in a bag, number of tails in tossing coin
-
-
Continuous Random Variable
-
- X is a continuous because it has a infinite number of values between two values
- Example : distance travelled, Height of students
What is Probability Distribution?
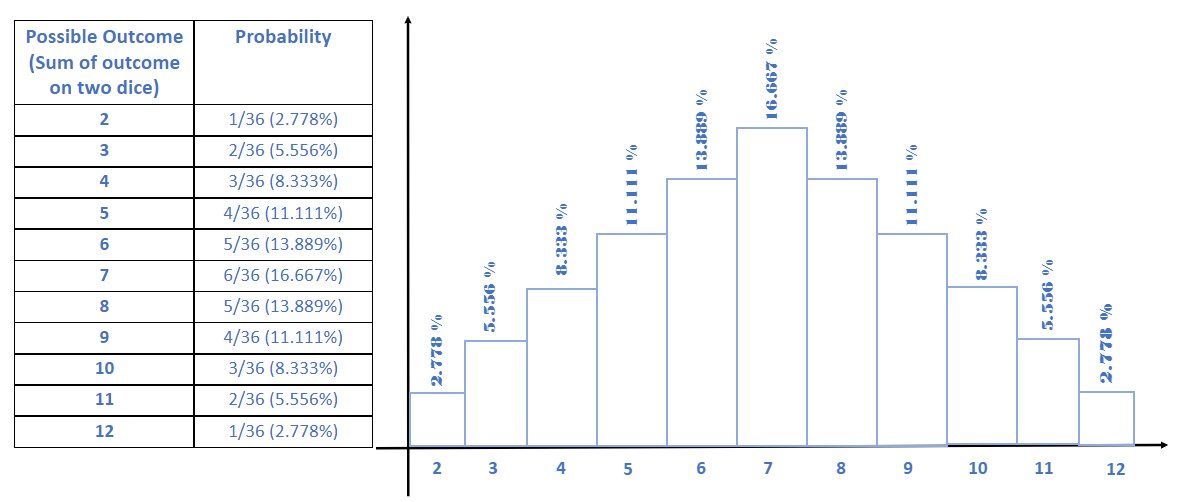
A Probability Distribution of a random variable is a list of all possible outcomes with corresponding probability values.
Note : The value of the probability always lies between 0 to 1.
What is an example of Probability Distribution?
Let’s understand the probability distribution by an example:
When two dice are rolled with six sided dots, let the possible outcome of rolling is denoted by (a, b), where
a : number on the top of first dice
b : number on the top of second dice
Then, sum of a + b are:
| Sum of a + b | (a, b) |
| 2 | (1,1) |
| 3 | (1,2), (2,1) |
| 4 | (1,3), (2,2), (3,1) |
| 5 | (1,4), (2,3), (3,2), (4,1) |
| 6 | (1,5), (2,4), (3,3), (4,2), (5,1) |
| 7 | (1,6), (2,5), (3,4),(4,3), (5,2), (6,1) |
| 8 | (2,6), (3,5), (4,4), (5,3), (6,2) |
| 9 | (3,6), (4,5), (5,4), (6,3) |
| 10 | (4,6), (5,5), (6,4) |
| 11 | (5,6), (6,5) |
| 12 | (6,6) |
- If a random variable is a discrete variable, it’s probability distribution is called discrete probability distribution.
- Example : Flipping of two coins
- Functions that represents a discrete probability distribution is known as Probability Mass Function.
- If a random variable is a continuous variable, it’s probability distribution is called continuous probability distribution.
- Example: Measuring temperature over a period of time
- Functions that represents a continuous probability distribution is known as Probability Density Function.
Types of Probability Distributions
Uniform Distribution
What is Uniform Distribution?
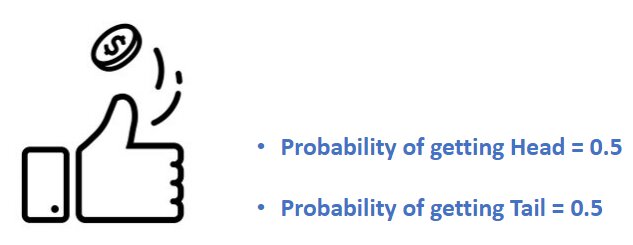
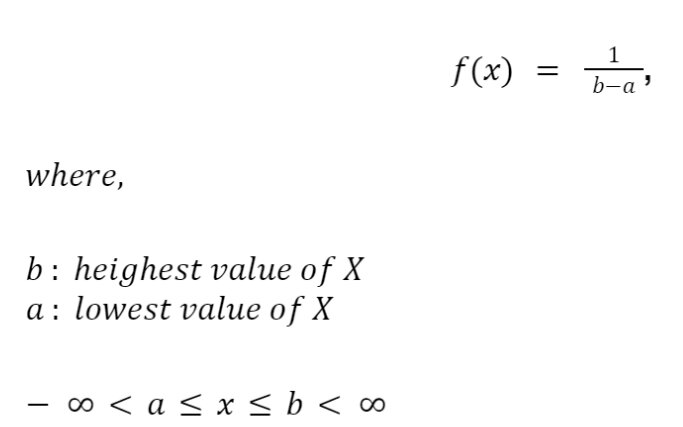
Probability distribution in which all the outcome have equal probability is known as Uniform Distribution.
Example: Perfect Random Generator
What is an example of Uniform Distribution?
Let’s understand by an example
Consider an experiment of tossing a single coin:
- Random variable X is uniformly distributed if the distribution function is given by:
Bernoulli Distribution
What is Bernoulli Distribution?
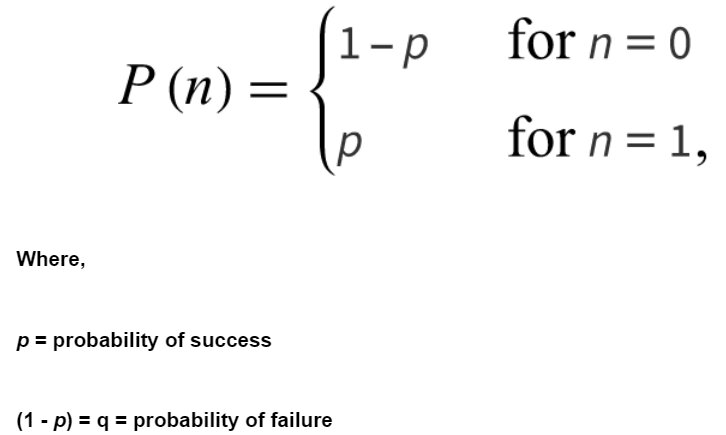
A discrete probability distribution for a random experiment that has only two possible outcomes (Bernoulli trials) is known Bernoulli Distribution.
Example: India will win cricket world cup or not
- It has only two possible outcome
- Success (1)
- Failure (0)
- Random variable n is Bernoulli distributed if the distribution function is given by:
What is an example of Bernoulli Distribution?
Let’s understand by an example
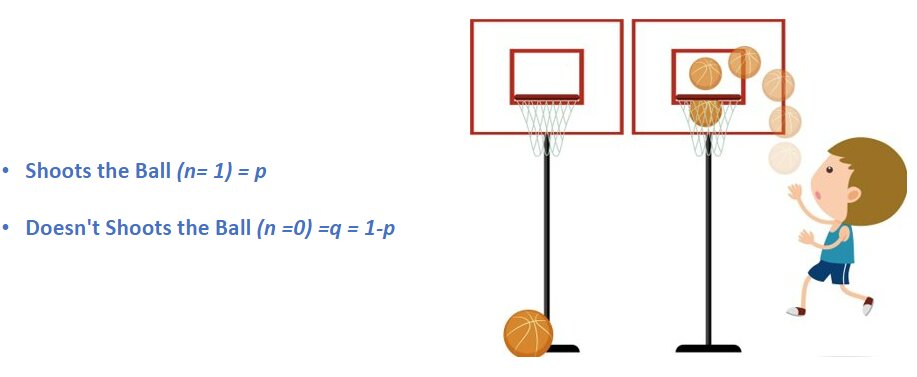
Consider an experiment of Shooting of Basketball
Binomial Distribution
What is Binomial Distribution?
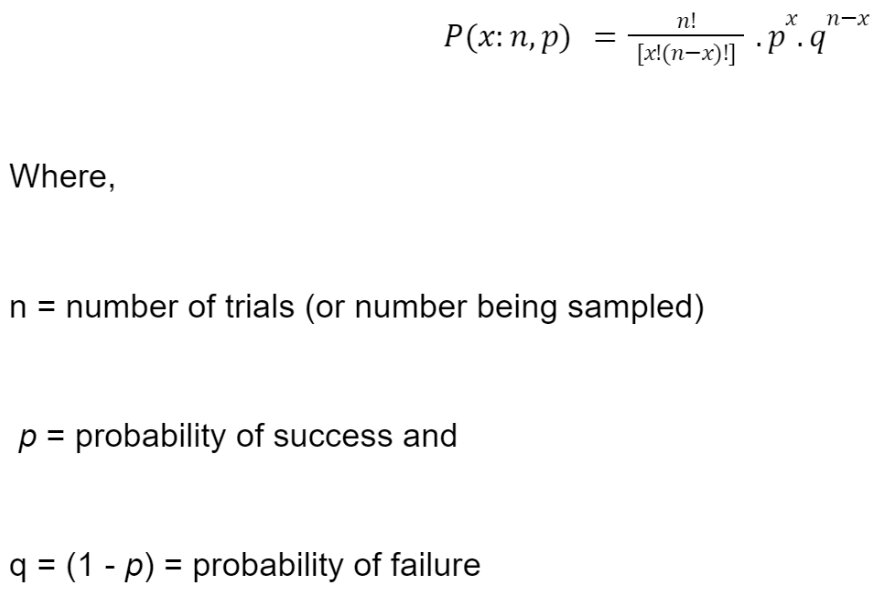
A discrete probability distribution that gives only two possible outcomes in n independent trails is known as Binomial Distribution.
Example: Yes/No survey
- Extension of Bernoulli Distribution
- Represent the number of success and failure into n independent trials
- The probability of success and failure is the same for all independent and identical trails.
- Random variable X is binomial distributed if the distribution function is given by:
- Mean = np
- Variance = npq
- Mean > Variance
What is an example of Binomial Distribution?
Let’s understand the Binomial Distribution by an example,
Consider the experiment of Picking Balls
Problem Statement:
Let there are 8 white balls and 2 black balls, then the probability of drawing 3 white balls, if the probability of selecting white ball is 0.6.
Difference between Binomial and Bernoulli’s Distribution
| Bernoulli | Binomial |
| Deals with the single trial event | Deals with the outcome of Multiple trials of the single events |
| Has only two possible outcome 0 and 1 | Sum of identically and independent distributed Bernoulli Random Variable |
Poisson Distribution
What is Poisson Distribution?
A discrete probability distribution that measures the probability of a random variable over a specific period of time is known as Poisson Distribution.
Example: Probability of Asteroid collision over a selected year of period.
- Used to predict probability of number of successful events.
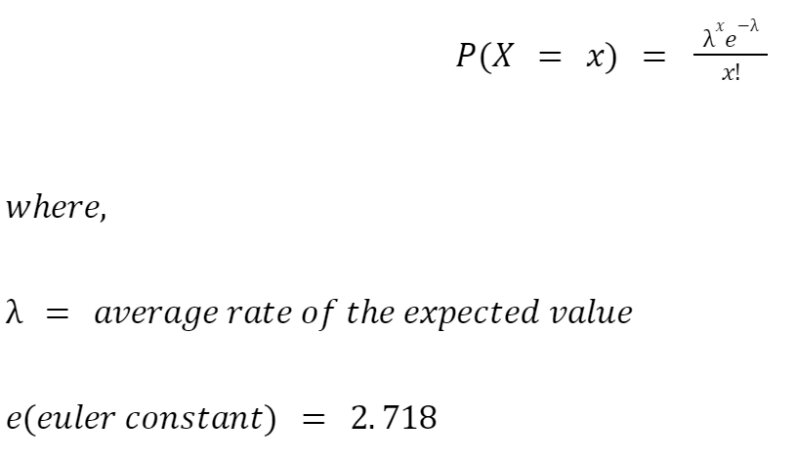
- Random variable X is Poisson distributed if the distribution function is given by:
Note: In case of Poisson Distribution Mean = Variance
What is an example of Poisson Distribution?
Let’s understand the Poisson Distribution by an example,
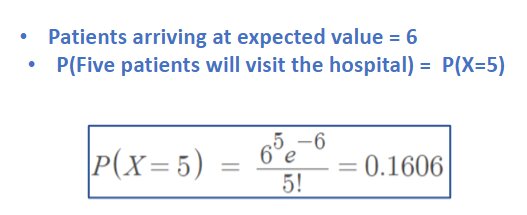
Consider the experiment of Number of patient visiting in a hospital
Problem Statement :
Let in a hospital patient arriving in a hospital at expected value is 6, then what is the probability of five patients will visit the hospital in that day?
Difference between Poisson Distribution and Binomial Distribution
| Poisson | Binomial |
| Number of trials are infinite | Number of trials are fixed |
| Unlimited number of possible outcomes | Only two possible outcomes (Success or Failure) |
| Mean = Variance | Mean > Variance |
Normal Distribution (Gaussian Distribution):
A continuous probability distribution, which is symmetric about it’s mean value (i.e. data near the mean are more frequency in occurrence) is known as Normal Distribution.
What is an example of Normal Distribution?
Lets’ understand the Normal Distribution by an example,
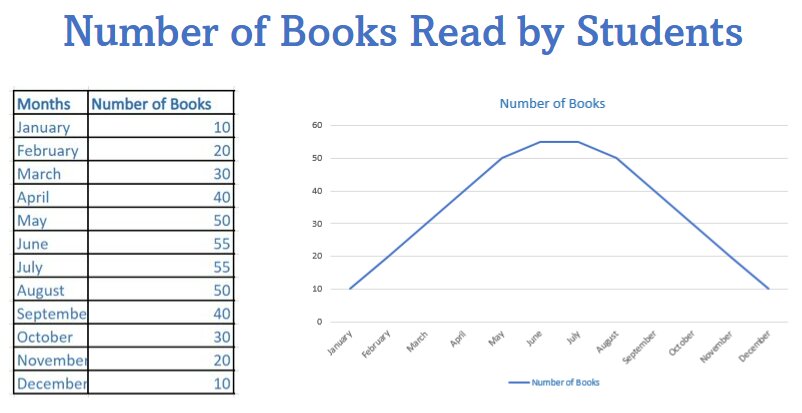
Consider the experiment of Number of books read by students in a school
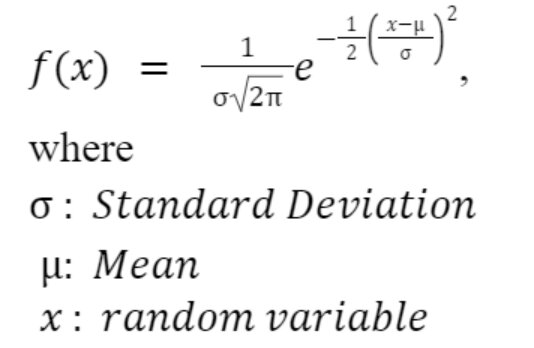
- Random variable X is normally distributed if the distribution function is given by:
Empirical Rule:
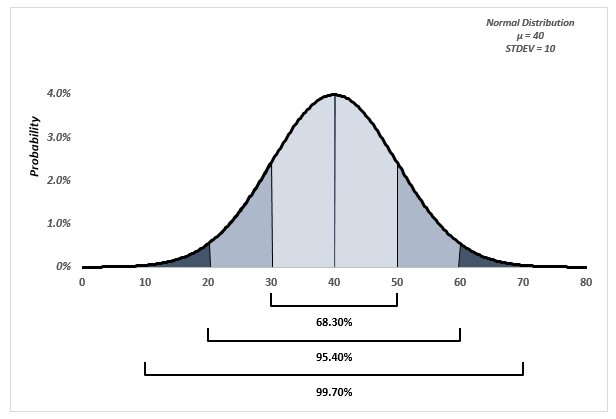
Empirical Rule is often called the 68 – 95 – 99.7 rule or Three Sigma Rule. It states that on a Normal Distribution:
- 68% of the data will be within one Standard Deviation of the Mean
- 95% of the data will be within two Standard Deviations of the Mean
- 99.7 of the data will be within three Standard Deviations of the Mean
- Characteristics of Normal Distribution :
- Symmetrical around its mean value
- Mean = Median = Mode
- Total area under the curve is 1
- Curve of the distribution is bell curve
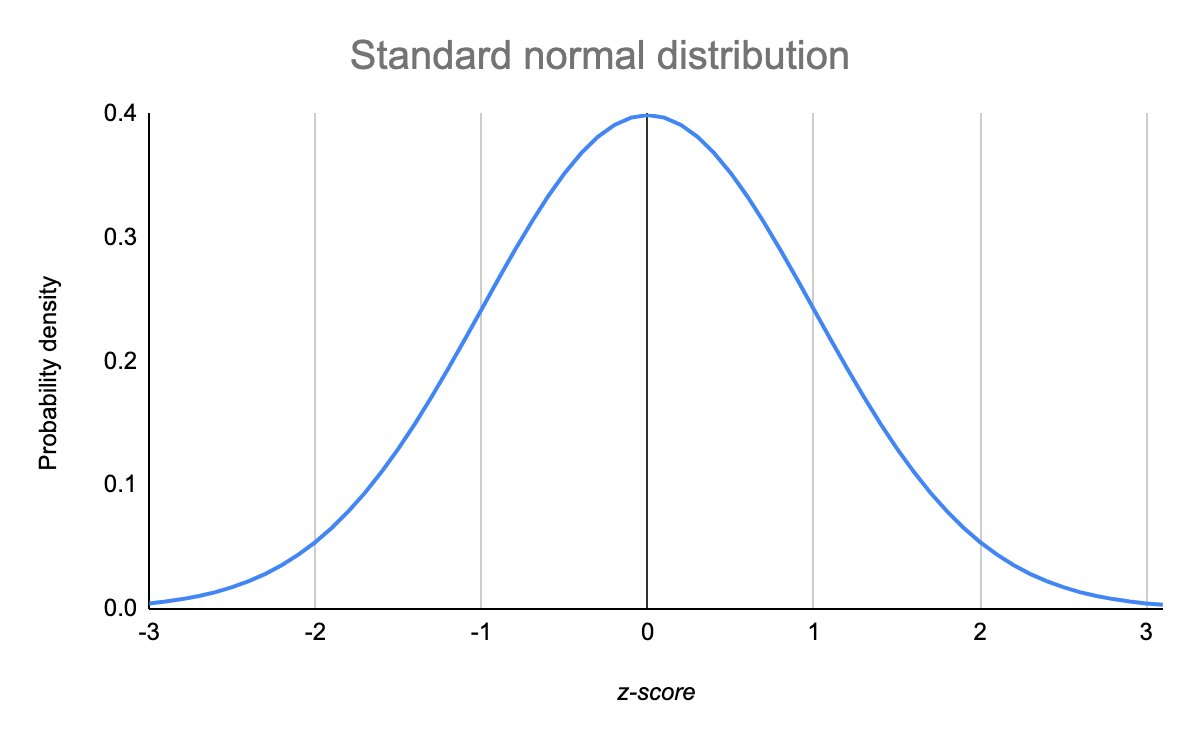
Standard normal distribution
- Normal distribution with mean = 0 and standard deviation = 1.
- For any random Variable X, probability distribution function is given by:
Difference between Poisson and Normal Distribution
| Poisson | Normal |
| Use Discrete Data | Use Continuous Data |
| Distribution vary on mean value | Symmetric about mean value |
| Mean = Variance | Mean = Median = Mode |
Probability distributions are not a Graph.
A graph is just a visual representation
Conclusion:
From the article, you will have a clear understanding of Probability Distributions in Data Science. This article highlights 5 important probability distributions with their applications. I hope this article will help you in your Data Science journey.
Frequently Ask Question
Q1. What are the different types of Random Variables?
A1.
Discrete Random Variable X is a discrete because it has a countable values between two numbers
Example : number of balls in a bag, number of tails in tossing coin
Continuous Random Variable X is a continuous because it has a infinite number of values between two values
Example : distance travelled, Height of students
Q2. What is Probability Distribution?
A2. A Probability Distribution of a random variable is a list of all possible outcomes with corresponding probability values.
Note : The value of the probability always lies between 0 to 1.
Q3. Types of Probability Distribution used in Data Science
A3. 1. Uniform Distribution 2. Bernoulli Distribution 3. Binomial Distribution 4. Poisson Distribution 5. Normal Distribution
Top Trending Articles in Statistics:
Skewness In Statistics |Statistics Interview Question |Basics Of Statistics |Measure Of Central Tendency |Probability Distribution |Inferential Statistics |Measure Of Dispersion |Introduction To Probability |Bayes Theorem |P-Value |Z-Test |T-Test |Chi-Square Test |Outliers In Python |Sampling and Resampling |Regression Analysis In Machine Learning |Gradient Descent |Normal Distribution |Poisson Distribution |Binomial Distribution |Covariance And Correlation |Conditional Probability |Central Limit Theorem
FAQs
Types of Random Variables
Discrete Random Variable X is a discrete because it has a countable values between two numbers Example : number of balls in a bag, number of tails in tossing coin Continuous Random Variable X is a continuous because it has a infinite number of values between two values Example : distance travelled, Height of students
What is Probability Distribution?
A Probability Distribution of a random variable is a list of all possible outcomes with corresponding probability values. Note : The value of the probability always lies between 0 to 1.
Types of Probability Distribution
1. Uniform Distribution 2. Bernoulli Distribution 3. Binomial Distribution 4. Poisson Distribution 5. Normal Distribution


