Table Calculation Function in Tableau
In this article, we will discuss table calculation in tableau and different types of tableau calculation function with examples.
Table of Content
Best-suited Tableau courses for you
Learn Tableau with these high-rated online courses
What is Table Calculation in Tableau
It is a type of visualization that is applied to the values in the visualization. It has some special features apart from the usual calculation in the Tableau:
- A special type of calculated field that works with the local data
- Calculation is totally based on what is currently in the visualization
- It doesn’t consider any measure or dimension that is filtered out of visualization
Table Calculation in Tableau is used to transform the values to ranking, show running totals, and show the percent of the total.
Must Check: What is Tableau?
Must Check: Tableau Online Courses & Certifications
Basics of Table Calculation
While dealing with the table calculation in Tableau, we will use the two words Partitioning and Addressing very frequently, so let’s discuss them first:
Partitioning Field
- The dimension that defines how to group is called partitioning fields
- Table calculations are performed separately for each partition
- It breaks the view up into multiple sub-view(or sub-tables), and then table calculation is applied for each partition
Addressing Field
- The remaining dimension on which table calculation is performed is called Addressing Field
- These are used to determine the direction of calculation
When we add table calculation in Tableau, Tableau itself determines some dimensions as addressing and others as partitioning. But when we want a specific dimension, then we have to decide which dimension are used for addressing and which is for partitioning.
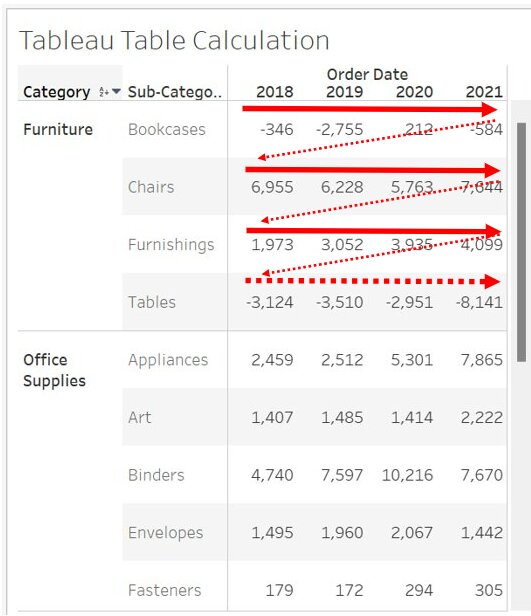
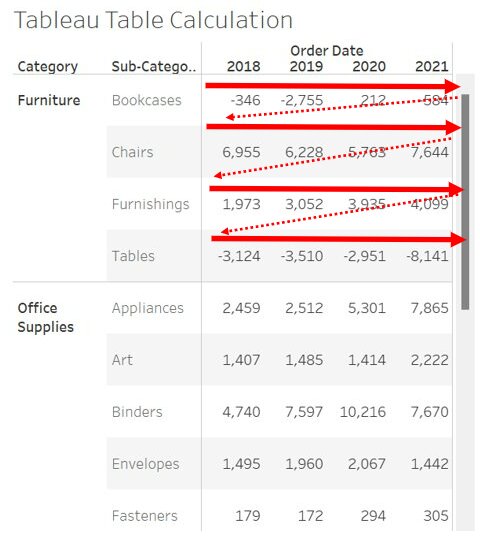
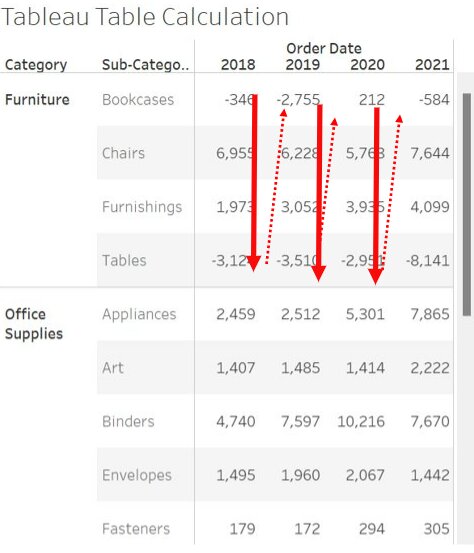
Table (Across)
It will compute across the length of the table and will restart after every partition
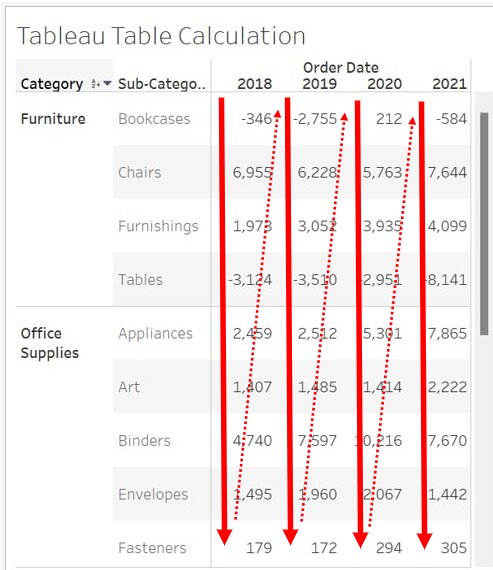
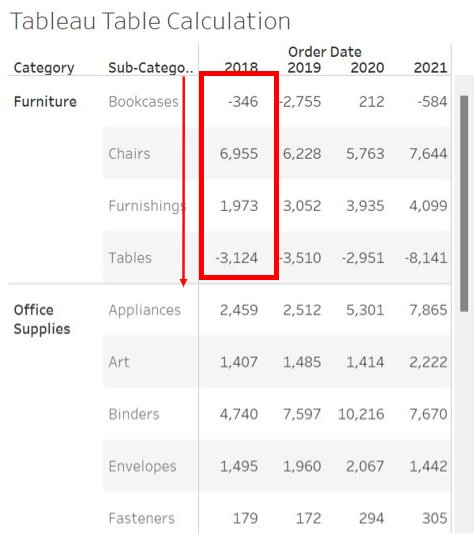
Table (Down)
It will compute down the length of the table and will restart after every partition
Table (Across the Down)
It will compute across the length of the table and then will go down the length of the table
Table ( Down then Across)
It will compute down the length of the table and then will go across the length of the table.
Pane (Down)
It will compute down an entire pane
Pane (Across then Down)
It will compute across an entire pane and the down the pane
Pane (Down the Across)
It will compute down an entire pane and then across the pane
Now, finally, we will discuss why to use the table calculation function and the different types of table calculation functions available in Tableau.


Table Calculation Function
Why to use Table Calculation Function?
Tableau calculation function allows:
- Compare a singular measure to itself
- Converting values into ranking
- Changing values to display running tools and show the percentage of total
Note: Tableau calculations are created locally and present in the view, i.e., they can’t be reused in the data source
Table Calculation Function
index()
- t will return the index of the current row in the partition without sorting
- Indexing starts with one, i.e., the first-row index is 1.
- Syntax: INDEX()
- Example: If you are currently on the 10th row in the partition, then INDEX () will return 10
first()
- It will return the number of rows from the current row to the first row in the partition
- Syntax: first()
- Example: If you are currently on the ten the row in the partition, then first() will return -9
last()
- It will return the number of rows from the current row to the last row in the partition
- Syntax: last()
- Example: If there are 10 rows in your partition and you are currently on the 7th row, then the last will return 3
lookup()
- It returns the value of the selected targeted expression and points to the relative offset in the current row.
- In offset is advised to use first() + n or last() – n if the target is related to the first and last part of the partition.
- Syntax: LOOKUP(expression, [offset])
- Example: LOOKUP(SUM (Marks), first()+2)
- It will add the sum(marks) in the third row of the partition.
Rank()
- It will return the standard competition rank for the current row.
- Syntax: RANK(expression, [‘asc’|’desc’])
- asc and desc denote ascending and descending order, respectively
- The default is descending order.
- Example: If (20, 25, 23, 23, 45, 12) are the marks of the student of a class, then the set of values would be ranked (5, 2, 3, 3, 1, 6)
RANK_DENSE
- It will return the dense rank for the current row in the partition.
- Identical values are assigned an identical rank, but there is no gap inserted in the rank sequence.
- Syntax: RANK_DENSE(expression, [‘asc’|’desc’])
- The default is descending order.
- Example: If (20, 25, 23, 23, 45, 12) are the marks of the student of a class, then the set of values would be ranked (4, 2, 3, 3, 1, 5)
Note:
- Nulls are ignored in both RANK() and RANK_DENSE()
- Apart from RANK and RANK_DENSE, we have RANK_MODIFIED, RANK_PERCENTILE, AND RANK_UNIQUE functions as well to work with the rank data.
Window_AVG
- It will return the average of the input expression within the window (i.e., the number of rows you selected)
- Syntax: WINDOW_AVG(EXPRESSION, [start, end])
- If in the function, start and end are omitted, then the entire partition will be selected
- Example: WINDOW_AVG (SUM[Marks], FIRST()+5, 0)
- The above function will calculate the average of marks from the 6th row to the current row.
Similar to WINDOW_AVG, we can use WINDOW_SUM, WINDOW_COUNT, WINDOW_VAR, WINDOW_STDEV, WINDOW_MAX, WINDOW_MIN, WINDOW_MEDIAN, WINDOW_COVAR, WINDOW_CORR and WINDOW_PERCENTILE.
RUNNING_SUM
- It will calculate the running sum of the given expression
- i.e., each value is added to the previous value
- Syntax: RUNNING_SUM(expression)
- Example: RUNNING_SUM(SUM[Sale]) will return the running sum of SUM[Profit]
Similar to the RUNNING_SUM(), we have RUNNING_AVG, RUNNING_COUNT, RUNNING_MAX, and RUNNING_MIN.
SIZE
- It will return the number of rows in the partition
- Syntax: SIZE()
- Example: If there are ten rows in the partition, the size of the data partition is 10.


Conclusion
In this article, we have discussed tableau table calculation and different types of tableau calculation function with examples.
Hope this article, will help you in your data analytics journey.
Top Trending Articles:
Introduction To Tableau | Products Of Tableau | Data Types In Tableau | Change Data Type In Tableau | File Type In Tableau | Data Aggregation | Connecting Data In Tableau | Dimension And Measure | Tableau Show Me | Joins In Tableau | Union In Tableau | Operators In Tableau | Number Functions In Tableau | String Functions In Tableau | Filter In Tableau | Context Filter In Tableau | Filters In Tableau | Types Of Charts In Tableau | Bar And Line Chart In Tableau | Pareto Chart In Tableau | Gantt Chart In Tableau | Box And Whisker Chart In Tableau | Waterfall Chart In Tableau | Donut Chart In Tableau | Funnel Chart In Tableau | Dual Axis Chart In Tableau | Sort Data In Tableau | Tableau Sets | Groups In Tableau | Tableau Hierarchy | Tableau Forecasting | Highlighting In Tableau | Word Cloud In Tableau | Cohort Analysis In Tableau


