Time Intelligence Functions in Power BI
Power BI offers a wide range of time intelligence features that support reporting company performance. It allows to build measures, unlike Excel’s cell-based calculations. This article explores the importance and applications of Power BI time intelligence functions that can facilitate the dashboard-building process.
For our businesses, time is an asset in the same way that resources, materials, and money are. Businesses utilize cumulative time-based computations, often known as YTD, MTD, and QTD (Year-to-Date, Month-to-Date, or Quarter-to-Date). They are useful measures for trend analysis or for comparing sales and financial results. However, calculating these data in Microsoft Excel using pivot tables and algorithms may be a nightmare.
Without explicitly storing the calculations in a different sheet and referring back to them, Power BI’s Time intelligence functions enable us to do calculations that can analyze company performance in real-time. When measuring trends in business KPIs across time, Power BI developers turn to the time intelligence functions (year-on-year, quarter-on-quarter, compared to last year, etc.).
For instance, you would want to assess Year-to-Date (YTD) profitability and prepare a strategy to close the gap compared to the annual target. A further indicator to consider is performance in comparison to the prior year, month, or quarter. They may use this information to compare the current business performance to that of the same time last year.
Must Check: Free PowerBI Online Courses and Certificate
Must Check: Top PowerBI Online Course and Certificate
In this blog, we will go through the following points to gain practical experience while learning about various Time Intelligence features.
Table of Content
Best-suited Power BI courses for you
Learn Power BI with these high-rated online courses
Prerequisite – Getting the Data
Before we dive into the details of how Time intelligence functions in Power BI can be easily and efficiently implemented, let me draw you a picture regarding our sample data. Let’s say we have a data set from an online store. To comprehend trends and analyze market patterns, we need to create several visualizations. Sometimes the data is not enough to make such a decision.
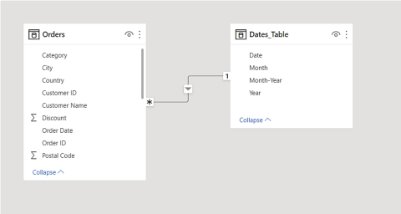
You might require one Date table in your data model before you can begin using Time Intelligence functions. The Date table should also meet the following specifications.
- Date/time data type in a Date column
- Unique values for the date column
- No blanks or missing values
- The date column should cover the entire year.
If you want to create an automatic Date table with all required columns, please follow this article for date table creation.
Moving forward, let us quickly get our data into the Power BI desktop. For the demonstration, I am taking a data set which is in Excel format.
- First, select the Get Data option from the Home tab.
- Choose the Excel workbook option from the drop-down list because our dataset is an Excel file.
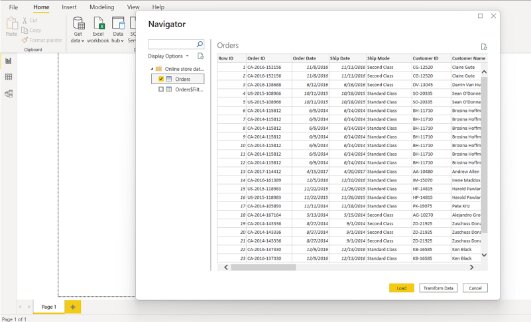
- Choose the Online store data file.
- After file selection, data will be shown in the format shown below.
- Then select Load and Save Data.
- Create a date table with the necessary fields in this data model.
Since now our date table is ready, we are ready to investigate time intelligence functions.
Read Also: PowerBi Comparison Chart
Exploring different Time Intelligence Examples
For DAX time intelligence functions, there are two basic classifications: summarizations over time and comparisons over time. It is also possible to perform some additional time intelligence calculations.
Analyzing year-to-date, quarter-to-date, and month-to-date
There are two approaches to creating measures for summarization over time.
First, you need to create one calculated measure of Total Sales. Consequently, based on this, you may create the next set of measures based on this.
- Using CALCULATE Function
Below you can see the use of three functions; DATESYTD, DATESQTD, and DATESMTD using the CALCULATE function.
- Without using CALCULATE Function
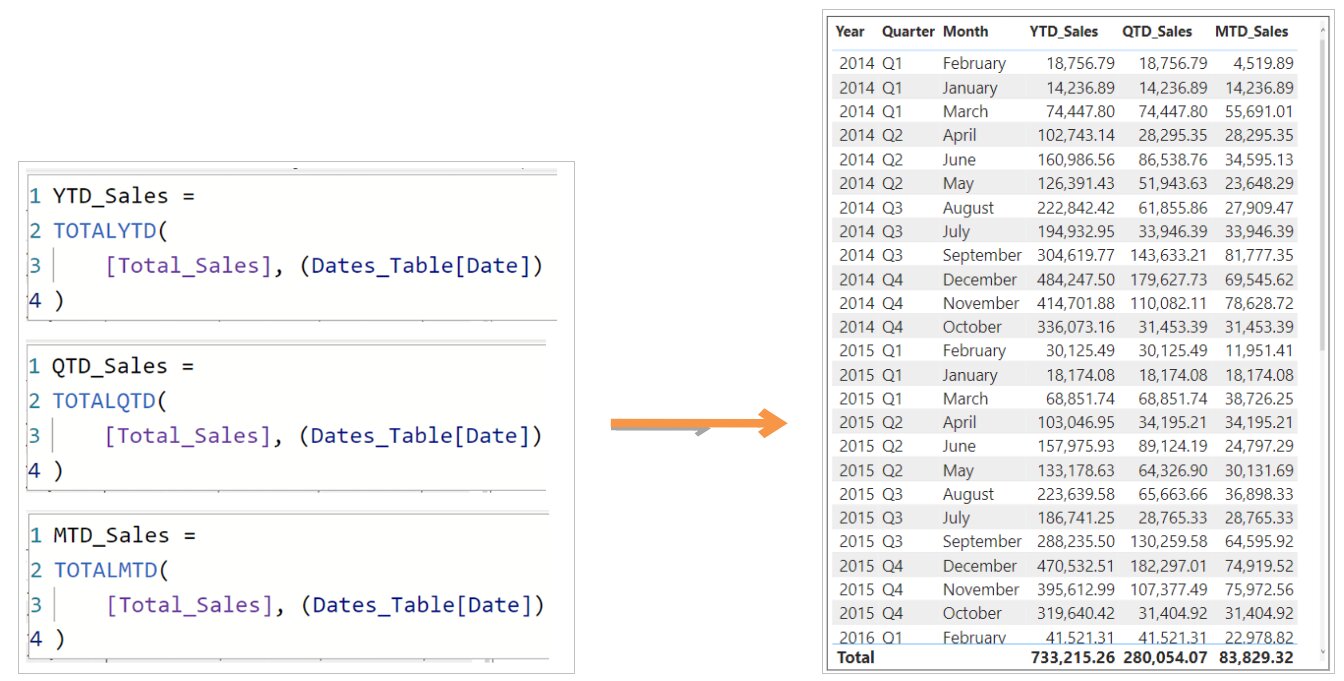
We will now use the simplified DAX functions to to-date calculations TOTALYTD, TOTALQTD, and TOTALMTD.
There are a few functions that are of a similar kind, such as STARTOFYEAR, ENDOFYEAR, OPENINGBALANCEYEAR, and CLOSINGBALANCEYEAR.
Read Also: Creating PowerBI Dashboard
Calculating current time periods from earlier time periods
These features are quite helpful for comparing trends between a time period this year and the same time period last year.
- Using DATEADD Function
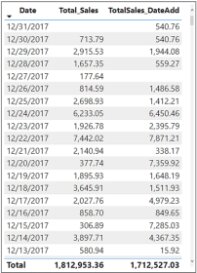
DATEADD can be used to compare data with values for the previous or following date. Let’s check out what the DATEADD function return.
Basically, I used DATEADD to construct a new column on top of the standard date column. I have implemented the one-month ago rule in the DATEADD column.
One thing which you need to note is that we can use four different intervals in the DATEADD formula.
- Comparing 3 months ago sales value
For example, our customers want to see current sales value and they want to see 3 months ago sales value in the current context.
Our Sales date is 12/26/2017 in the current context and DATEADD moved this date to 3 months ago. It means we will compare the 09/26/2017 date in the current context. From this case, we can infer that-
- On 12/26/2017 sales amount was 814.59.
- On 09/26/2017 sales amount was 1486.58.
We can conclude that DATEADD is effective when-
- We want to compare a value with X period ago or later.
- We can find periodic changes.
- Using SAMEPERIODLASTYEAR Function
Some DAX functions in Power BI could be substituted for one another. After examining how to apply SAMEPERIODLASTYEAR in our measures, we will examine the differences between SAMEPERIODLASTYEAR and the following functions.
It returns a table with dates that were moved by one year back in newly generated columns.
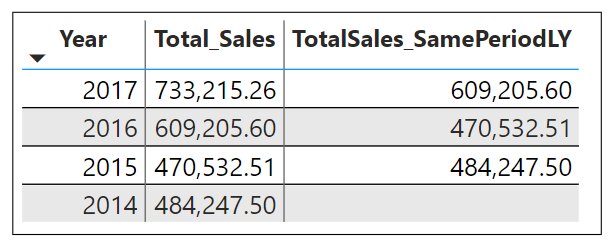
In order to demonstrate how it functions, I’ll use Total Sales Measure with SAMEPERIODLASTYEAR.
Now let us check out its output-
Our current date is 7/16/2017 and we have a 316.64 Sales Amount. Now let us see what the value is for last year in the current context;
The same number can be seen in red rectangles in the current context. It is standard behavior to be able to forecast which numbers will be returned using SAMEPERIODLASTYEAR. In this section, we just looked at daily values. Let’s compare the yearly time frames side by side.
From this scenario, we can conclude that SAMEPERIODLASTYEAR is effective-
- We want to modify the calculation of last year.
- For flexibility of different date levels.
- Using PARALLELPERIOD Function
The function PARALLELPERIOD returns a table with a column of dates that, in the context of the current context, represents a period parallel to the dates in the supplied dates column, with the dates, shifted a number of intervals either ahead or backward in time.
Let’s understand in detail how we might use PARALLELPERIOD in our calculations.
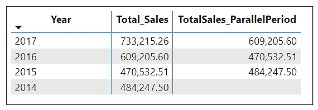
Similar to the DATEADD function, any interval other than SAMEPERIODLASTYEAR must be entered to calculate a value. In this scenario of PARALLELPERIOD, we want to go back one year.
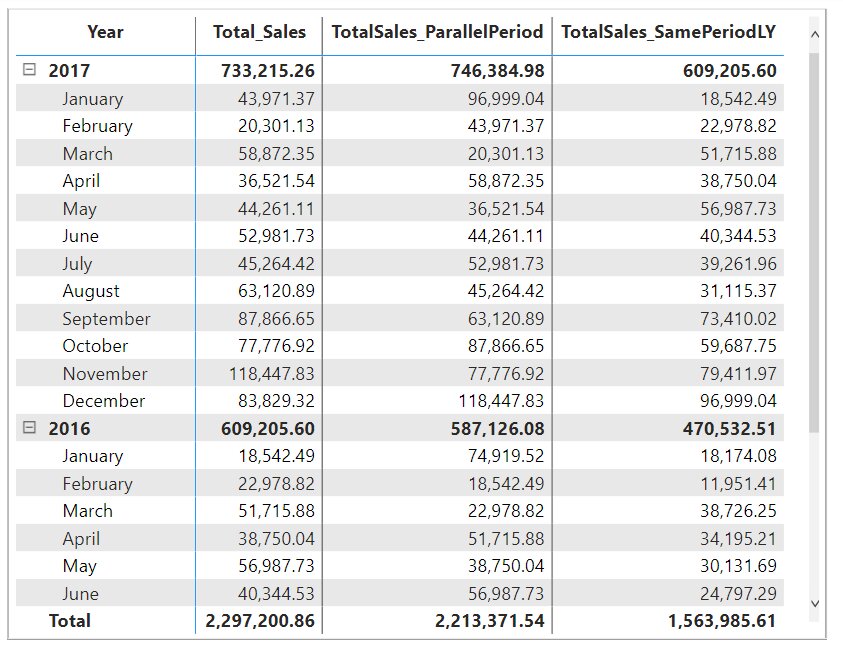
For each row in the monthly view, PARALLELPERIOD returns the total sales amount value.
There is a distinction between PARALLELPERIOD and DATEADD; PARALLELPERIOD always appears to be full periods that are set internally. In this example, we simply set the formula to an annual interval. In addition, there are the options of a month and a quarter.
In the below image, the red arrow is for PARALLELPERIOD (month) and the purple arrow is for SAMEPERIODLASTYEAR.
Allow me to sum up some important features of the DATEADD, SAMEPERIODLASTYEAR, and PARALLEPERIOD functions for you-
- SAMEPERIODLASTYEAR only looks back one year. DATEADD and PARALLELPERIOD can look beyond an interval, both backward and forward.
- The results of calculations using the three DAX formulas are impacted by the filter context, especially SAMEPERIODLASTYEAR and DATEADD.
- PARALLELPERIOD only works with month, year and, quarter intervals, but DATEADD can also work with day intervals.
Read Also: PowerBI vs Tableau
Calculating Moving Annual Total
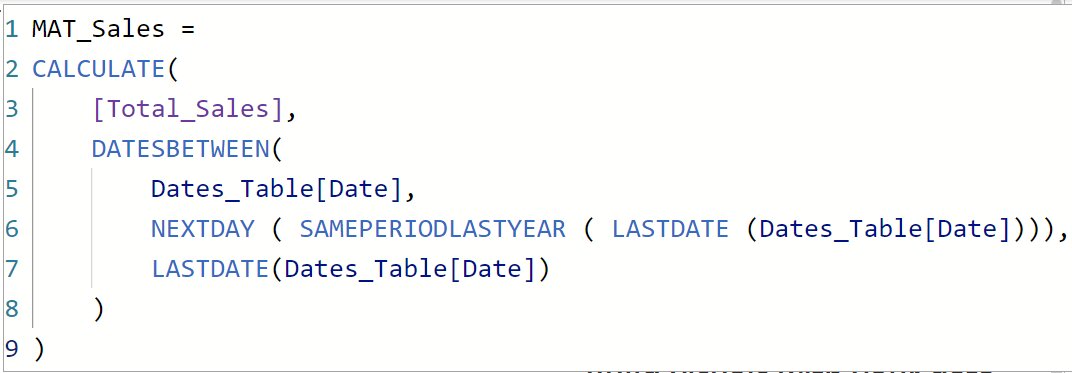
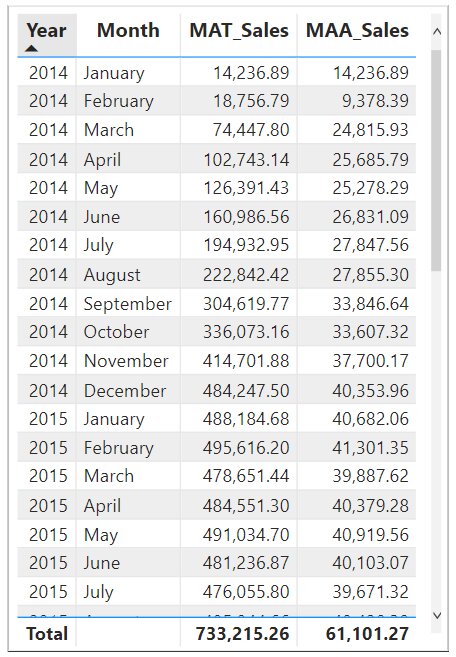
The moving annual total (MAT), which includes the aggregation over the previous 12 months, is another approach that avoids seasonal swings in sales amount.
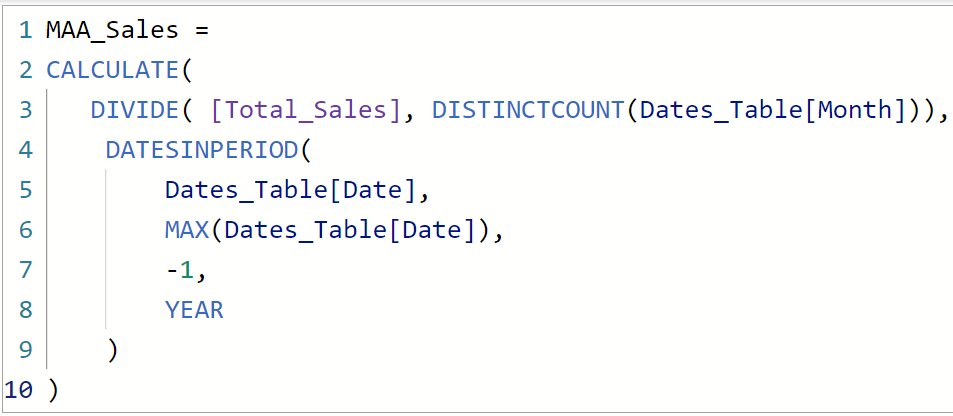
This MAT value is averaged across the time period by dividing it by the number of months included in the period, giving you a moving annual average (MAA).
Conclusion
In this article, we learned about the significance of time intelligence in assessing business performance. To recap, the following are the steps to use the time intelligence functions in Power BI.
- Create a date table and use it as a dimension, filter, or theme table. Without a date table, none of these time intelligence functions will function.
- Create a general measure, give it some thought, and then determine whether the outcome of the measure provides an answer to your business query.
- Add a time intelligence function to the general measure, such as changing DATEYTD to DATEQTD. While the results will alter, the pattern will remain the same.
To sum up, Power BI offers a wide range of time intelligence features that support reporting company performance. Furthermore, Power BI allows us to build measures, unlike Excel’s cell-based calculations. Measures can instantly assess any level of detail for specific time computation.
This is a collection of insightful articles from domain experts in the fields of Cloud Computing, DevOps, AWS, Data Science, Machine Learning, AI, and Natural Language Processing. The range of topics caters to upski... Read Full Bio


