How to Create a Word Cloud in Tableau
In this article, we will briefly discuss about word cloud in tableau and how to create word cloud with an example.
Table of Content
Best-suited Tableau courses for you
Learn Tableau with these high-rated online courses
What is Word Cloud in Tableau?
The tableau word cloud is a visualization method that displays how frequently any word appear in a given body or dataset of text. The size of the words are proportional to their frequency in the dataset.
It is also known as a Tag cloud or text cloud.
All the text (words) are arranged in a cluster or cloud of words.
It is typically used to depict keyword metadata (tags) free from the text and one of the simplest forms of text analysis that we can perform in Tableau.
Confused!!!
Don’t worry; we will understand with the help of an example.
Must Check: What is Tableau?
Must Check: Tableau Online Courses & Certifications
When you carefully observe the above image, you will get the tags (tags are usually single-word) like Data, Search, Development, Business, and Leadership many times, or you can say that these words appear more frequently.
Analyzing the above image is very easy as it has only a few tags or keywords to look them up and get the result quickly, but what if we have a long text or speech and we have to take out the most frequent words from that.
In that case, you can’t do it manually by going through every line and counting all the different words, and maintaining all the records.
Here, Tableau Word Cloud comes into action and does text analysis in just a few steps.
Note:
- Word cloud is mainly used to give viewers a quick and clear understanding of the most frequent words from the data.
- Word cloud does not emphasize the importance of words, so it may be possible that the meaning of words may be lost.
Till now, I think you have got a clear understanding of word cloud and its importance.
So, now we will see how to create Word Cloud in Tableau with the help of an example.


How to Create a Word Cloud in Tableau
In Tableau, we can create a word cloud mainly in 4-5 steps; let’s have a look:
Problem Statement: Using Sample Super Store data, in which state the products are delivered more frequently.
Steps to Create Word Cloud:
- Connect the Sample Super Store Data
- Drag and Drop State to Text on the Mark pane
- Drag and Drop State to Size on the Mark pane
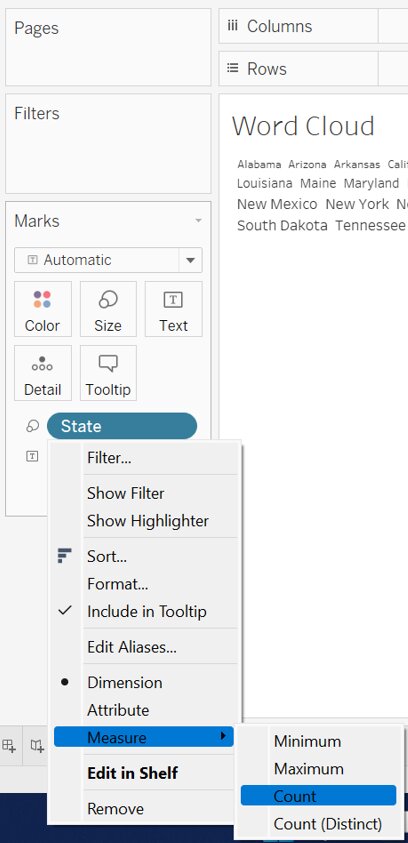
- Right-click on State on the Size card -> Select Measure -> Count
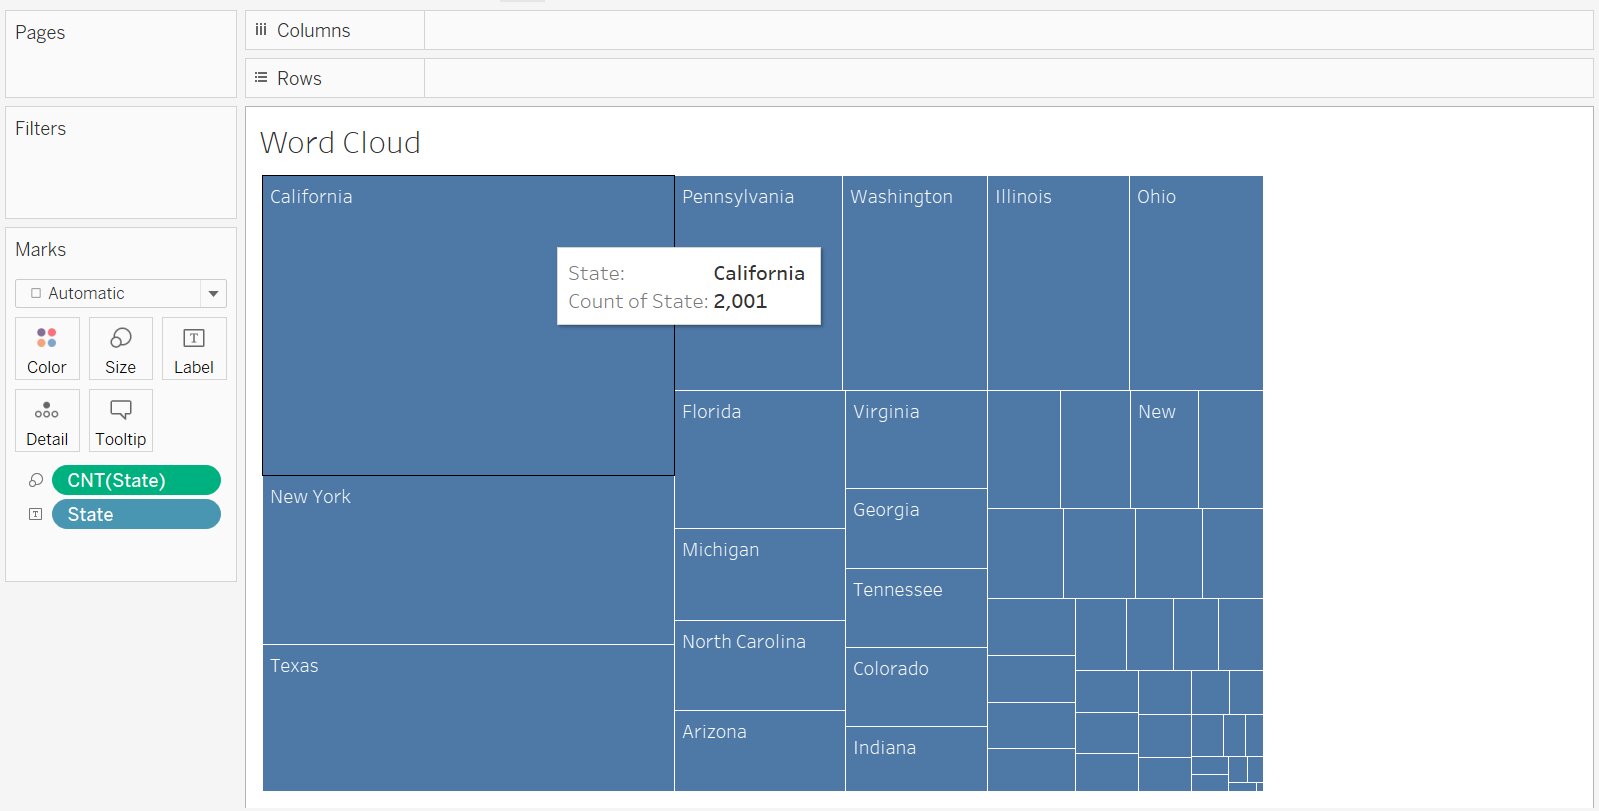
- You will get the Word Cloud of states (the size of states will depend on the frequency of that state in the dataset)
Here in the above image, the size of the block of California is maximum in between all the states (which is repeated 2001 times in the dataset).


In this article, we will discuss one of the important concepts...read more
Additional Resource
Add Color
Now, we will add color to distinguish all the states
- Drag and Drop State to Color on the Mark Pane
Now, finally, we can change the Mark Type
Change the Mark Type
- In the Mark Pane
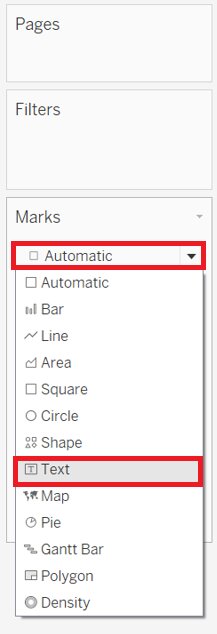
- Click on Drop-Down -> Change the Mark Type from Automatic to Text
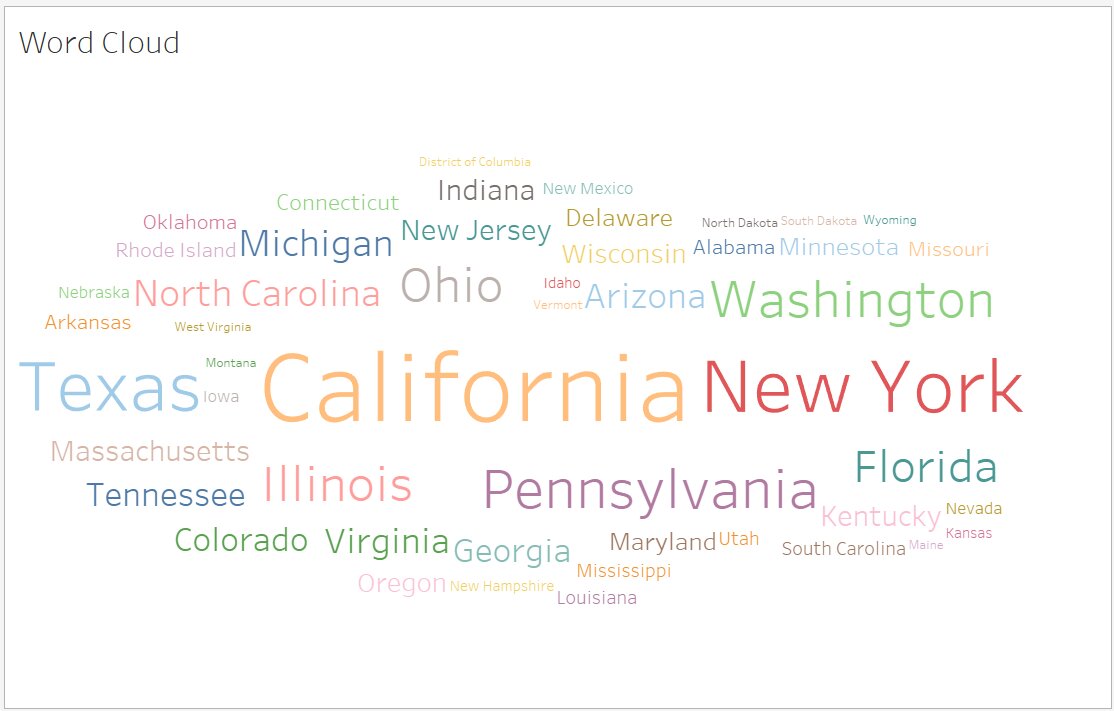
You will get the word cloud in the text format, and the size of the tags will be varied according to the frequency of the data; the higher the frequency bigger the size of the tags.
This is pretty cool, isn’t it?
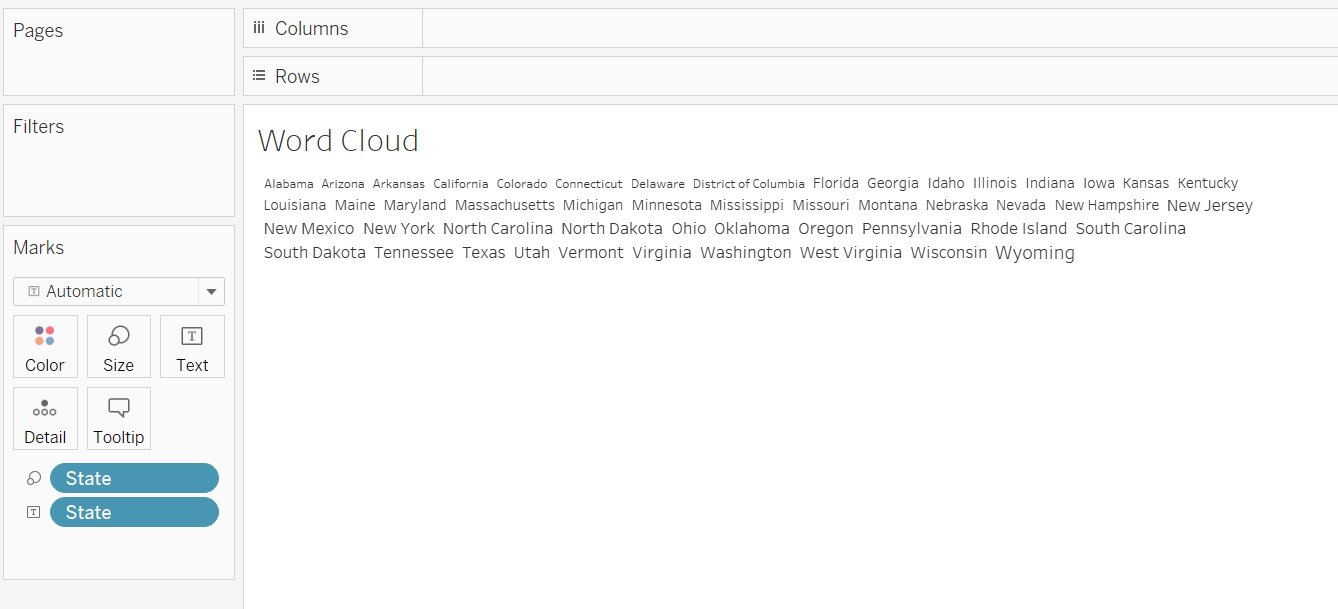
The above image contains the name of all the states, and the tag size represents their frequency in the data set.


Conclusion
In this article, we have discussed one of the applications of Tableau, i.e., Word Cloud, that provides differentiation between words depending on the frequency of words. We also covered how to create a word cloud using an example.
Hope this article will help you in your data analytics journey.
Top Trending Articles:
Data Analyst Interview Questions | Data Science Interview Questions | Machine Learning Applications | Big Data vs Machine Learning | Data Scientist vs Data Analyst | How to Become a Data Analyst | Data Science vs. Big Data vs. Data Analytics | What is Data Science | What is a Data Scientist | What is Data Analyst

Vikram has a Postgraduate degree in Applied Mathematics, with a keen interest in Data Science and Machine Learning. He has experience of 2+ years in content creation in Mathematics, Statistics, Data Science, and Mac... Read Full Bio


