z-test : Definition and Example
z-test is a statistical method for the comparison of mean in a sample from the normally distributed population or between two independent samples. In this article we will briefly discuss z-test, types of z-tests with different examples.
z-test is a statistically significant test for Hypothesis Testing. There are 3 steps in Hypothesis Testing:
- State Null and Alternate Hypothesis
- Perform Statistical Test
- Accept and reject the Null Hypothesis
In this article, we will discuss the z-test, the mathematical formula, and how to calculate it with the help of an example.
Must Check: Statistics Interview Questions
Table of Content
Best-suited Statistics for Data Science courses for you
Learn Statistics for Data Science with these high-rated online courses
What is z-test?
Statistical method for the comparison of mean in a sample from the normally distributed population or between two independent samples
Or
Statistical test to validate the hypothesis (accept or reject) when the data is normally distributed.
z-test is used when:
- Population variance is unknown
- Sample size is greater than 30
Also Read: Difference between Null Hypothesis and Alternative Hypothesis
Also Read: Difference between One-tailed and Two-Tailed Test


Types of z-test:
Z-test is mainly classified into 2 types:
- One Sample
- Two Sample
One-Sample
- The one-sample test is used when we have to compare a sample mean with the population mean.
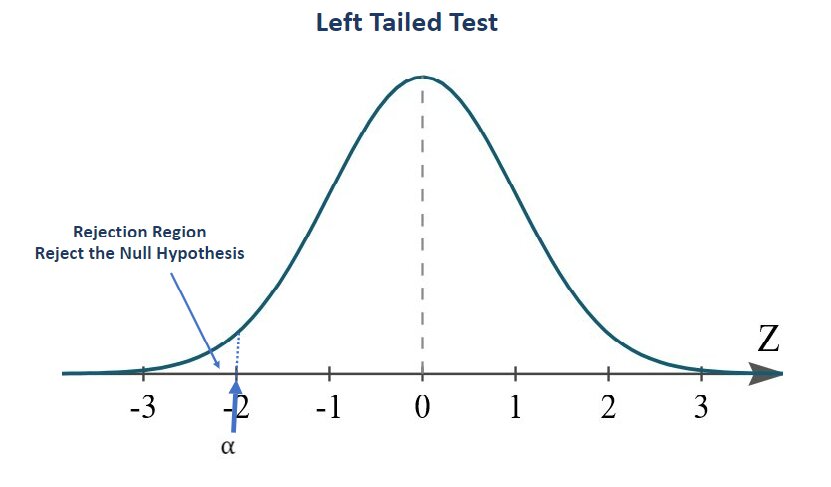
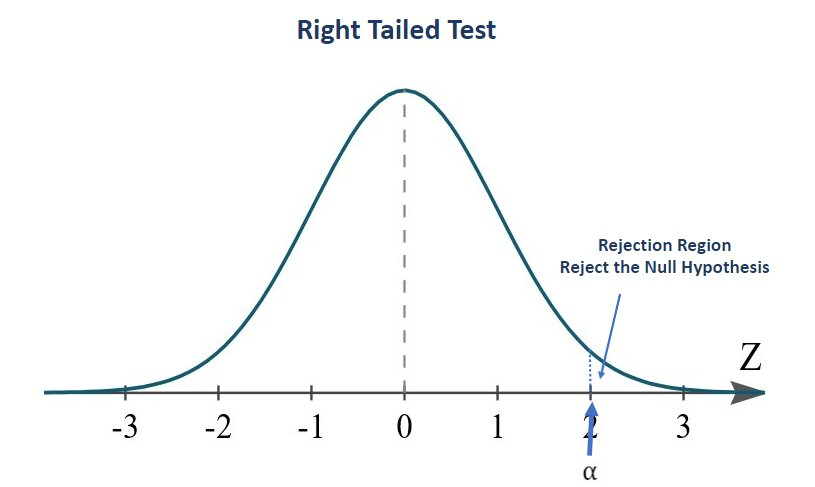
- The region of rejection is located either extreme left or extreme right of the distribution
i.e. if any null hypothesis: Sample mean is 2
Then, its Alternate hypothesis: Sample mean is either greater or less than 2
in this case, the rejection region will be on the left side of the distribution
Note: For the left tailed test, the claimed mean sample value for the null hypothesis will be less than or equal to the mean population value.
or
In this case, the rejection region will be on the right side of the distribution.
Note: For the right-tailed test, the claimed mean sample value for the null hypothesis will be greater than or equal to the mean population value.
Mathematical Formula:
Also Read: t-test
Also Read: chi-square test


Let’s understand the one-sample z-test by an example:
z-test Example
A gym trainer claimed that all the new boys in the gym are above average weight.
A random sample of thirty boys weight have a mean score of 112.5 kg and the population mean weight is 100 kg and the standard deviation is 15.
Is there a sufficient evidence to support the claim of gym trainer.
Also Read: p-value


Two-Sample:
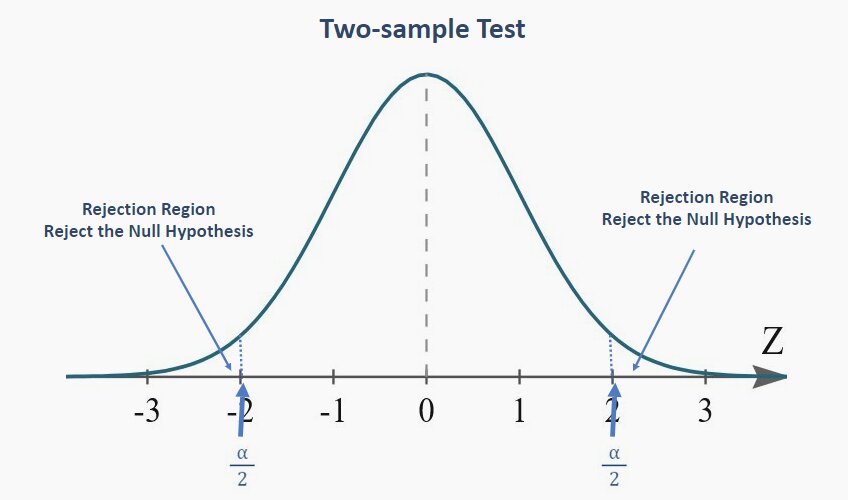
- A two-sample test is used when we have to compare the mean of two samples.
- The region of rejection is located on both the extreme (left and right) of the distribution
i.e. if any null hypothesis: Sample mean is 2
Then, its Alternate hypothesis: Sample mean is not equal to 2
Note: For two sample test, the claimed value for the null hypothesis will be equal to mean population value.
Mathematical Formula:
Let’s understand the two-sample z-test by an example:
Problem Statement:
Random samples of 75 males and 50 female’s donors yields mean concentration of 28 and 33 ppm respectively. The amount of trace elements in blood varies with the standard deviation 14.1 and 9.5 ppm respectively for males and females. What is the likelihood that the population means of concentration of elements are the same for men and women.
Conclusion:
Z-test is a statistically significant test for the hypothesis testing (null and alternative hypotheses) when the sample size is large, and the population parameter (mean and variance) is known. Hope you will like the article.
Keep Learning!!
Keep Sharing!!


FAQs
What is z-test with example?
Statistical test to validate the hypothesis (accept or reject) when the data is normally distributed. z-test is used when: 1. Population variance is unknown. 2. Sample size is greater than 30. Example: Random samples of 75 males and 50 female's donors yields mean concentration of 28 and 33 ppm respectively. The amount of trace elements in blood varies with the standard deviation 14.1 and 9.5 ppm respectively for males and females. What is the likelihood that the population means of concentration of elements are the same for men and women.
What is the difference between z-test and t-test?
z-test is a kind of hypothesis test that ascertains if the average of the two datasets is different from each other when standard deviation and variance are given, whereas the t-test is referred to as a kind of parametric test that is applied to identity how average of two sets of data differ from each other when the standard deviation and variance is not given.
What are the different types of z-tests?
There are two types of z-tests: 1. One Sample z-test 2. Two Sample z-test
What z-score means?
z-score is a measure of how many standard deviations below or above the population mean a raw score is. It gives an idea of how far a data point is from the mean. It can be placed on normal distribution curve. Value of z-score ranges from -3 standard deviation to +3 standard deviation.
What is a good z-score?
The choice of 'good' or bad 'z-score' is totally subjective, it totally depends on the individual choice, to determine whether a good z-score should be one that represents the 70th, 80th, 90th, 95th percentile, etc. The value of z-score ranges from -3 standard deviations (far left of the normal distribution) to +3 standard deviation (far right of the normal distribution)

Vikram has a Postgraduate degree in Applied Mathematics, with a keen interest in Data Science and Machine Learning. He has experience of 2+ years in content creation in Mathematics, Statistics, Data Science, and Mac... Read Full Bio


