Basics of Statistics for Data Science
As a data scientist, you must collect a large set of data, clean, validate, analyse, and finally make Decisions using the data and analytical tools. A decision is a choice that we make based on several possibilities having uncertainties.
A decision can be made possible in two ways:
- Intuition- what we think or what we feel without any logical approach
- Data or Information – Purely based on Logical and Scientific approach
The quantitative approach of making decisions using the Logical and scientific approaches is the key to Data Science, and the quantitative approach is called Statistics.
In this article, we will discuss the basic concepts of statistics like data type, random variable and probability distributions.
1. Data and Types:
Data is classified into Population and Sample:
1. Population
- Collection of all items of interest
- The number obtained from the Population is called the Parameter
2. Sample
- Subset of Population
- The number obtained from the sample is called the Statistics
Populations are hard to define and hard to observe in real life, while samples are less time-consuming and less costly. But the Sample must be Random and Representative.
Randomness:
A random sample is collected when each sample member is chosen from the population strictly by chance.
Representativeness:
A representative sample is a subset of the population that accurately reflects the members of the entire population.
Best-suited Statistics for Data Science courses for you
Learn Statistics for Data Science with these high-rated online courses
2. Random Variable and Properties
A random variable is a numerical description of the outcome of a random experiment.
Example:
- The number of bikes sold by any particular dealer of Hero.
- Weight of a person in kg.
Must Check: Introduction to Probability
The expectation for discrete Random Variable:
Let X be a discrete random variable that takes values x1, x2, x3,……, xn, with PMF(probability mass function) f(x)=P(X=x) then the expected value or mean is given by:
The expectation for discrete Random Variable:
Let X be a continuous random variable that takes values x1, x2, x3,……, xn, with PDF(probability density function) f(x) then the expected value or mean is given by:
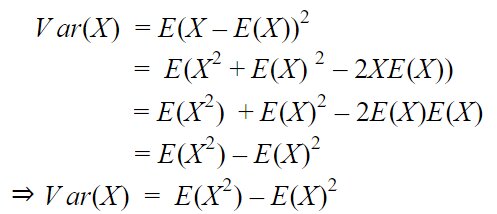
Variance:
The variance of a random variable(discrete or continuous) is given as:
Standard Deviation:
The standard deviation of a random variable (X) is defined as the square root of variance.
Must Check: Measure of Central Tendency: Mean, Median, and Mode.
Covariance and Correlation
Covariance is the measure of how much two random variables two vary together; it involves the relationship between two variables, and its value lies between – ∞ and ∞ .
Correlation indicates how strongly two variables are related, it can involve multiple variables as well, and its value lies between -1 and 1.
Must Check: statistician data management Online Courses & Certifications
Must Read: Difference Between Covariance and Correlation
3. Distribution
A probability distribution is a function that shows the possible values for a variable and how often they occur.
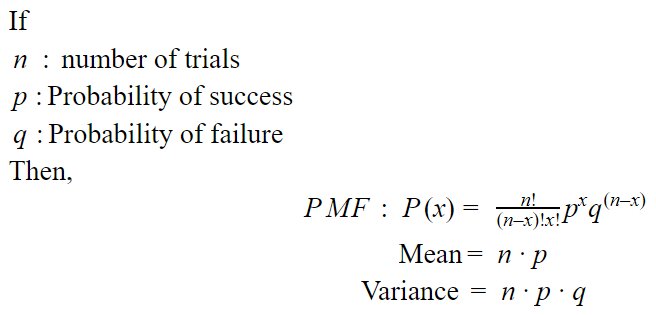
Binomial Distribution:
Distribution only two possible outcomes are possible, either success or failure and the probability of success and failure is the same. Each trial is independent.
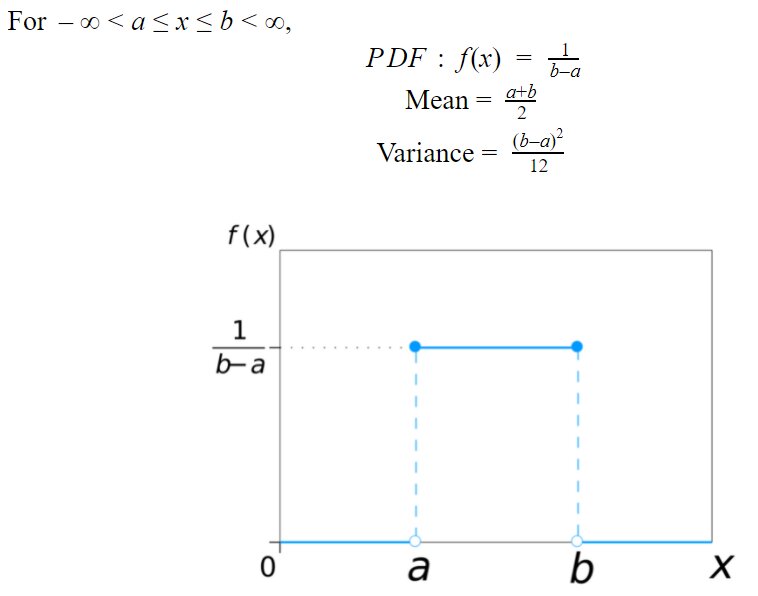
Uniform Distribution:
The distribution in which the probability of getting an outcome on every trial is equally likely.
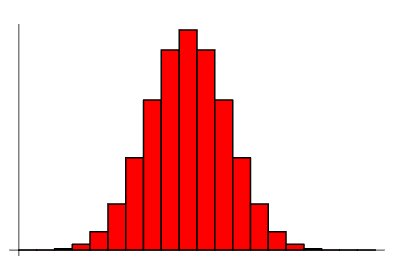
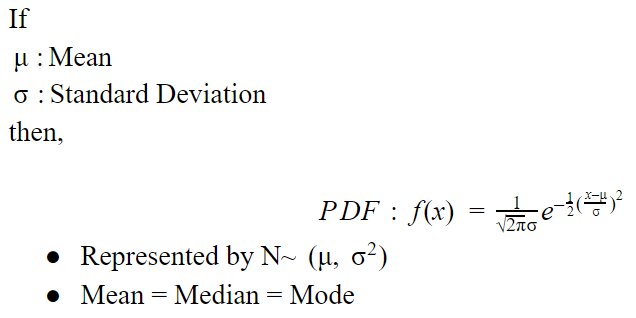
Normal Distribution:
The most important distribution.
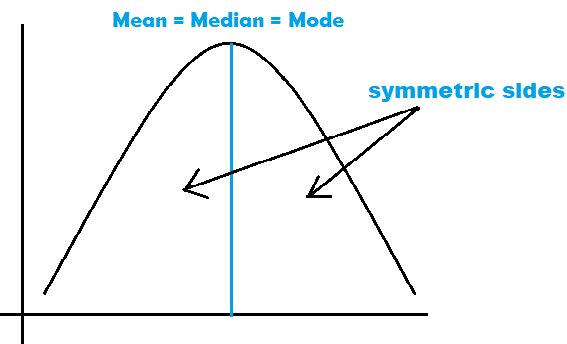
It is bell-shaped and symmetric about the mean; the total area under the curve is 1.
All measures of central tendency(Mean, Median, Mode) coincide.
- Standard Normal Distribution: A distribution with a mean of 0 and a standard deviation of 0 is called a standard normal distribution.
Normal Distribution can be standardized using:
Represented by N ~ (0,1).
Must Check: Statistics & Mathematics for Data Science & Data Analytics
Conclusion:
Statistics is one of the most important tools of Data Science; this article highlighted some important features of that not all. This will help you to get a basic understanding of concepts.
Top Trending Articles in Statistics:
Skewness In Statistics | Statistics Interview Question | Basics Of Statistics | Measure Of Central Tendency | Probability Distribution | Inferential Statistics | Measure Of Dispersion | Introduction To Probability | Bayes Theorem | P-Value | Z-Test | T-Test | Chi-Square Test | Outliers In Python | Sampling and Resampling | Regression Analysis In Machine Learning | Gradient Descent | Normal Distribution | Poisson Distribution | Binomial Distribution | Covariance And Correlation | Conditional Probability | Central Limit Theorem
FAQs
What is Sample and Population?
1. Population Collection of all items of interest The number obtained from Population is called Parameter 2. Sample Subset of Population The number obtained from the sample is called Statistics
What is a Random Variable?
A random variable is a numerical description of the outcome of a random experiment. Example: The number of bikes sold by any particular dealer of Hero. Weight of a person in kg.
What is a Randomness in Data?
A random sample is collected when each member of the sample is chosen from the population strictly by chance.
What is a Representativeness in Data?
A representative sample is a subset of the population that accurately reflects the members of the entire population.


