How To Calculate Percentage In Excel
Percentages are a very powerful tool for data analysis because they simplify complex data, making it easier to interpret and compare. When working with large datasets or performing financial calculations, percentages help in breaking down the data into more digestible parts, which can highlight trends, proportions, and relative magnitudes. In this tutorial, we will focus on how to calculate and use percentages in Microsoft Excel, a widely used tool for data management and analysis.
Calculating percentages is a crucial element of data analysis. Excel allows us to work with percentages efficiently within our spreadsheets. In this article, we will learn different techniques for calculating percentages in Excel.
Content
- What is the Percentage?
- Percent formula in Microsoft Excel
- Calculate Marks Percentages In Excel
- Add Percentages In Excel
- Subtract Percentages In Excel
- Percentage Change
- Use Paste Special for Changing Percentages (For One-Time Changes)
Must Read – What is MS Excel?
What is Percentage?
A percentage is a mathematical entity. It represents a proportion of a given part as a fraction of 100 equal parts. The symbol % denotes the percentage. It must be written after the value it refers to.
Percentages are a powerful tool for data analysis. They can be used to compare different data sets, track trends over time, and identify outliers. By understanding how percentages work, you can use them to make informed decisions and to better understand the world around you.
Best-suited MS Excel courses for you
Learn MS Excel with these high-rated online courses
Percentage Formula in Excel
You can enter a percentage in the cells using the percentage symbol (%). Excel will correctly identify it as a numerical value. The percentage formula in Excel is –
=> (Part/Whole)*100 = Percentage
The basic percentage formula applied by Excel is
= Numerator/Denominator
Let’s understand different techniques to calculate percentages under different scenarios.
Must Explore – Free MS Excel Courses
Calculate Marks Percentages In Excel
To calculate the percentage in Excel, we take the below datasheet. Here, we have marks obtained by a set of students. The maximum mark is 600. We need to calculate how much an individual student obtained.
To add the marks, we will use the SUM function
Now, we will calculate the percentage obtained by the students using –
=Marks obtained/Total marks (=H2/I2)
Once you auto-fill in, the formula applies to all the selected cells. You get the percentage secured by all the students.


Add Percentages In Excel
Sometimes, we need to increase an amount by a certain percentage. For example – there is a data set of a few vehicles to be launched in the market. In Column C, there is the cost of a vehicle before taxes.
We have to add a certain percentage of tax to every product as regulated. The tax is 0.2 times for some vehicles, while for some, it is 0.3 times. We will fill in the column with the taxes that need to be added to the cost of the vehicle.
To convert taxes into percentages, select the entire taxes column. Click the % symbol located in the Number section of the Ribbon.
Now we know the percentage of taxes to be added to the cost. We must add that percentage to the original value to obtain the final price of some products after taxes.
To add percentages in Excel, we use the formula
=C2 (cost of the vehicle)*(1+D2 {Percentage to be added})
=C2*(1+D2)
Press Enter.
Autofill all the remaining cells
We obtained the products’ values in the above dataset after adding the taxes. This example should help you to understand how to add percentages to your dataset and get a final value.


Subtract Percentages In Excel
If we need to subtract a percentage, the operation will be very similar to the previous one.
Let’s take an example of a product where we have a discount of 20% & 30%. We want to subtract this percentage from the original price. We will use the below formula to calculate the discount –
=C2*(1-D2)
Press Enter
Again, fill in the rest of the cells in the column.
We now have the final price of the vehicles after the mentioned discounts.
Must Explore – MS Excel Courses
Percentage Change
If you want to calculate the percentage change between two numbers, follow the below steps –
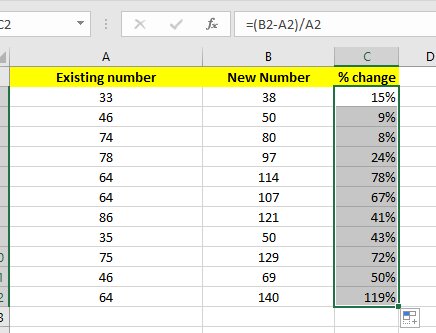
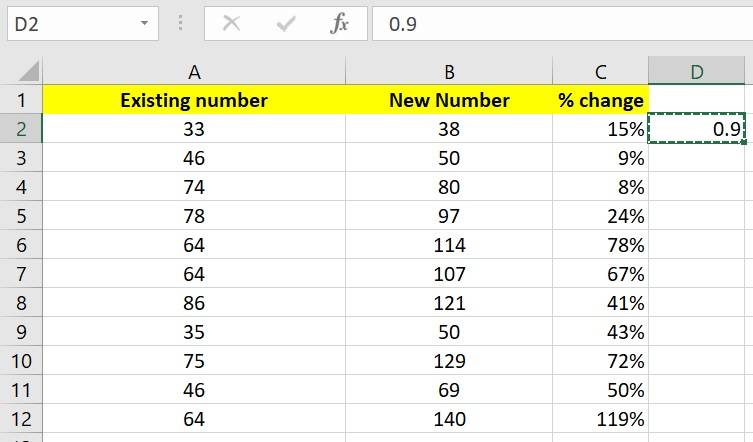
1. There is data in Column A. Add new numbers in Column B.
2. Apply the formula
=(B2-A2)/A2
3. Press Enter
4. Fill the rest of the cells using the autofill feature.
You get the percentage change in the original numbers.
Use Paste Special for Changing Percentages (For One-Time Changes)
If you want to increase or decrease the values in the same column (without creating a new column), you can use the Paste Special feature:
Example: Increase values in Column A by 10%
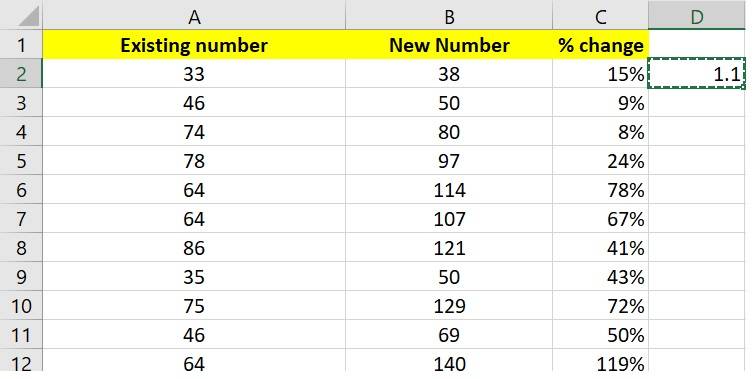
Step 1 - In an empty cell (e.g., Cell D2), type 1.10 (this represents a 10% increase).
Step 2 - Copy the value (press Ctrl + C).
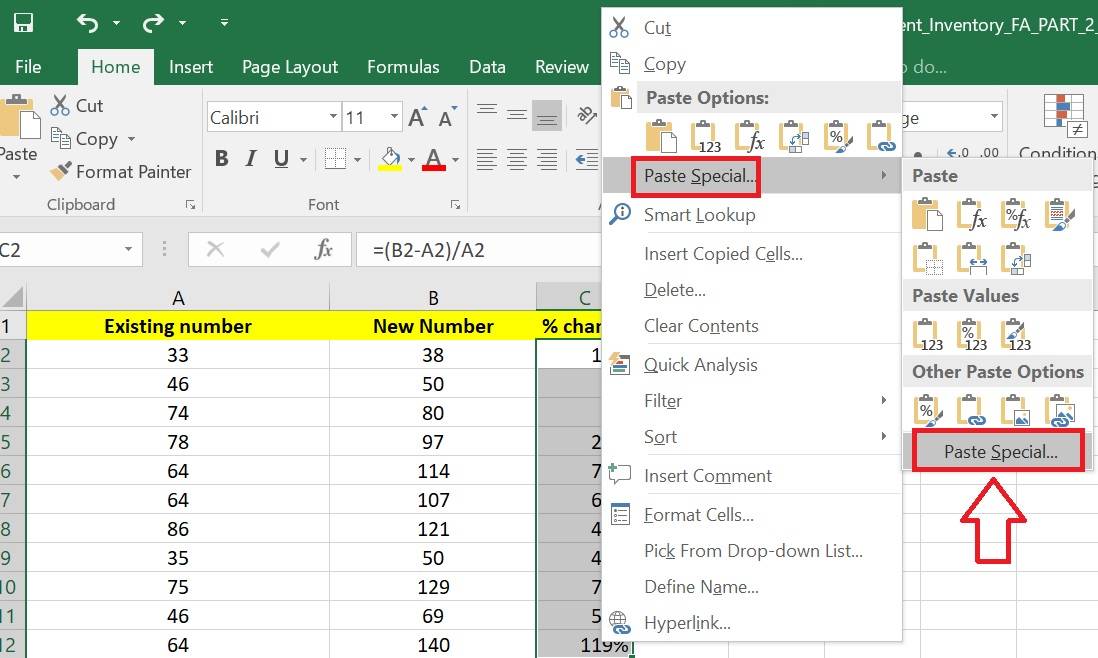
Step 3 - Select the range of cells in Column A that you want to increase (e.g., A1:A10).
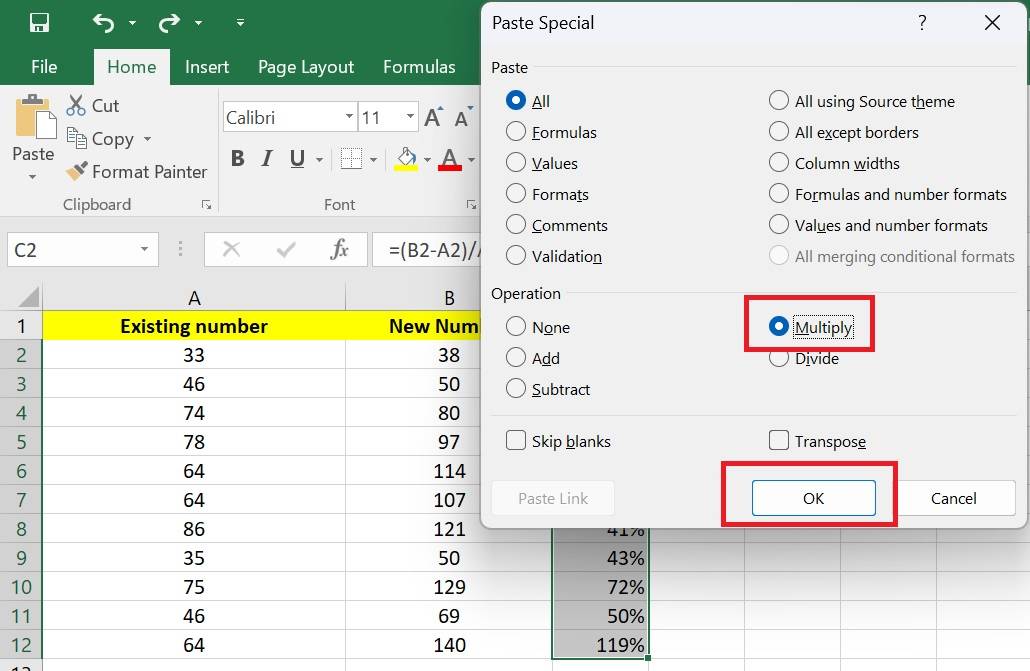
Step 4 - Right-click and select Paste Special.
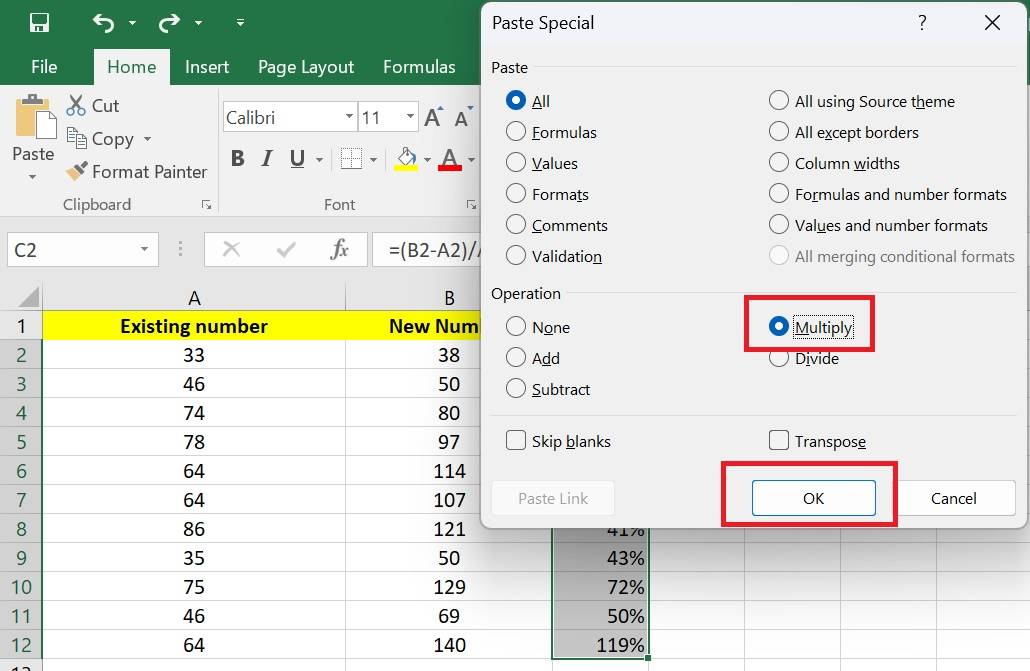
Step 5 - In the Paste Special dialog box, under the Operation section, select Multiply.
Step 6 - Click OK.
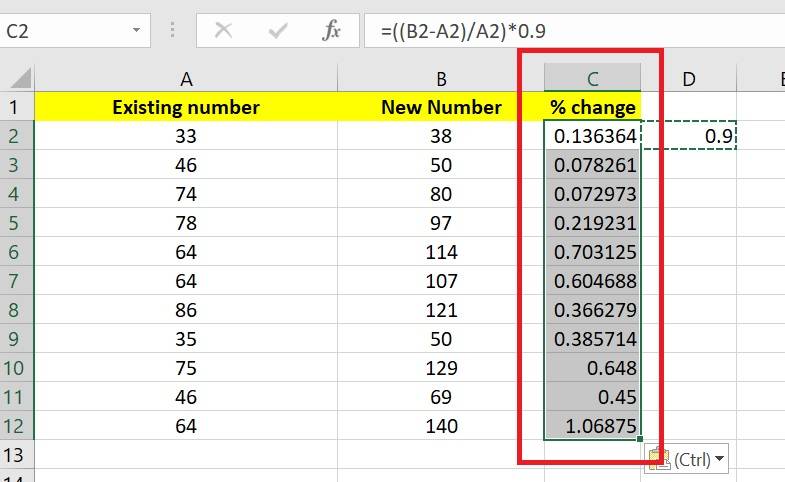
This will multiply all the values in Column A by 1.10, effectively increasing them by 10%.
Step 7 - Change into percentage by clicking %.
Example: Reduce values in Column A by 10%
Step 1 - In an empty cell (e.g., Cell B1), type 0.90 (this represents a 10% reduction).
Step 2 - Copy the value (press Ctrl + C).
Step 3 - Select the range of cells in Column A that you want to reduce (e.g., A1:A10).
Step 4 - Right-click and select Paste Special.
Step 5 - In the Paste Special dialog box, under the Operation section, select Multiply.
Step 6 - Click OK.
This will multiply all the values in Column A by 0.90, effectively reducing them by 10%.
Step 7 - Change into percentage by clicking %.
Note – The results will be dynamic since we have formulas applied in all the cells. Select all the data, and click on Paste Values. This way, the formula will be removed, and you will get the clean data.
Excel provides a variety of ways to calculate percentages. You must know how to calculate percentages in Excel to get the most out of the tool. The best method will depend on your spreadsheet’s specific needs. By understanding the different ways to calculate percentages in Excel, you can easily perform complex data analysis tasks.
Top Trending Articles in MS Excel:
Most Useful Excel Formulas | Min Max Functions in Excel | Average Functions in Excel | Introduction to MS Excel | Financial Modelling in Excel | MS Excel interview questions | Sum Function in Excel | Trim Function in Excel | Pivot Table in Excel | Percentage in Excel | Vlookup in Excel | Median Function in Excel | Types of Charts in Excel | Count Function in Excel | MS Excel Vs. Google Sheet | Remove Duplicates in Excel | Create Graph in Excel
FAQs
How do I calculate the percentage of the total?
To calculate the percentage of a total, divide the part by the total and multiply the result by 100. For example, if you want to calculate the percentage of students who passed a test, you would divide the number of students who passed by the total number of students who took the test.
How do I calculate the percentage of change between two numbers?
To calculate the percentage of change between two numbers, subtract the smaller number from the larger number and divide the result by the smaller number. Multiply the result by 100 to get the percentage of change.
How do I create a pie chart to show the percentage distribution of a group of numbers in Excel?
To create a pie chart to show the percentage distribution of a group of numbers in Excel, select the range of cells containing the numbers you want to chart and then click on the "Insert Pie or Doughnut Chart" button in the "Charts" group on the Insert tab.
How do I create a bar chart to show the percentage change between two number groups in Excel?
To create a bar chart to show the percentage change between two groups of numbers in Excel, select the range of cells containing the numbers you want to chart and then click on the "Insert Clustered Column Chart" button in the "Charts" group on the Insert tab.

Rashmi is a postgraduate in Biotechnology with a flair for research-oriented work and has an experience of over 13 years in content creation and social media handling. She has a diversified writing portfolio and aim... Read Full Bio


