Data Cleaning Using Pandas
Data preparation involves data collection and data cleaning. When working with multiple sources of data, there are instances where the collected data could be incorrect, mislabeled, or even duplicated. This would lead to unreliable machine learning models and wrong outcomes. Hence, it is important to clean your data and get it into a usable form beforehand. In this article, we cover the concept of data cleaning using Pandas.
As a data scientist, most of your time is going to be spent preparing your data for analysis. In fact, according to Forbes, data preparation is the ‘most time-consuming, least enjoyable data science task’. Naturally, one would want to increase productivity in this phase to move on to the more interesting parts – getting insights from data. Pandas is a very popular Python library mainly used for data pre-processing purposes such as data cleaning, manipulation, and transformation. It provides a quick and efficient way to manage and analyze your data. In this blog on data cleaning using Pandas, we will cover the following sections:
- What is Data Cleaning?
- Data Cleaning Using Pandas
- Finding duplicated values in a DataFrame
- Finding missing elements in a DataFrame
- Filling the missing values in a DataFrame
- Dropping columns in a DataFrame
- Changing the index of a DataFrame
- Renaming columns of a DataFrame
- Converting the data type of columns
What is Data Cleaning?
Data cleaning is the process of dealing with messy, disordered data and eliminating incorrect, missing, duplicated values in your dataset. It improves the quality and accuracy of the data being fed to the algorithms that will solve your data science problem.
Now, let’s get to the fun part, shall we?
Best-suited Python for data science courses for you
Learn Python for data science with these high-rated online courses
Data Cleaning Using Pandas
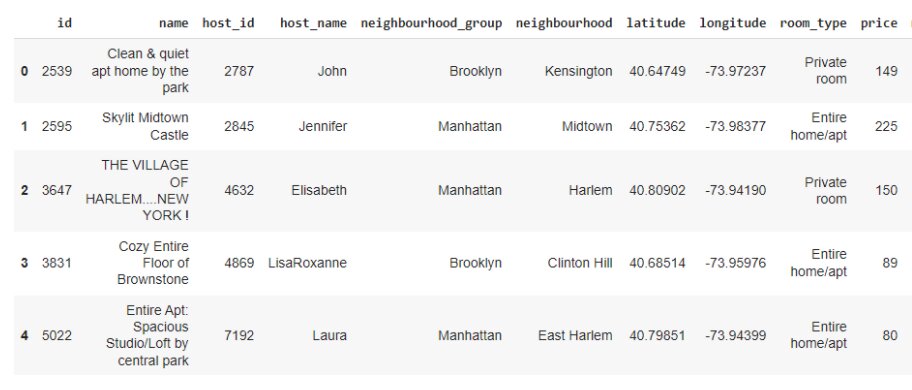
We are going to perform data cleaning using pandas. The data used in this blog can be found here. This dataset describes the Airbnb listing activity in New York City for the year 2019. It contains information about hosts, geographical availability, and other metrics required to make predictions and draw conclusions. Let’s start with preparing this data for it.
Firstly, let’s import the Pandas library:
import pandas as pd
Now, let’s load the dataset:
Displaying the first 5 rows of the dataset:
df.head()
df.info()
Use info() to get information about the dataset:
We can see all the 16 columns listed above along with their data types. You can also see the memory usage displayed at the end as 6+ MB.
Let’s start with our data cleaning process now –
Finding duplicated values in a DataFrame
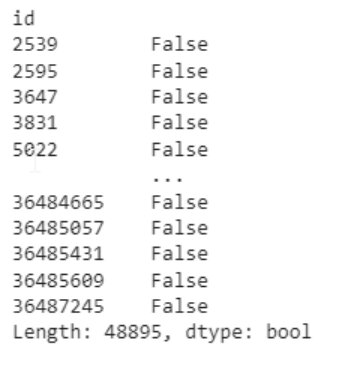
- duplicated(): This function displays the boolean values in a columnar format. False means no values are duplicated:
df.duplicated()
Each element of the ‘id’ column of the dataset is displayed, showing whether the value is duplicated or not.
But as you can see, there are 48895 elements here and we can’t check against each one individually. So, we will use the any() function to find out if there are any duplicated values at all:
df.duplicated().any()
So, there are no duplicate values. But if there were, we could’ve used the following syntax to remove those:
Syntax –
DataFrame.drop_duplicates(subset=None, keep=’first’, inplace=False, ignore_index=False)
Finding missing elements in a DataFrame
There are four ways to find the null values, if present, in the dataset.
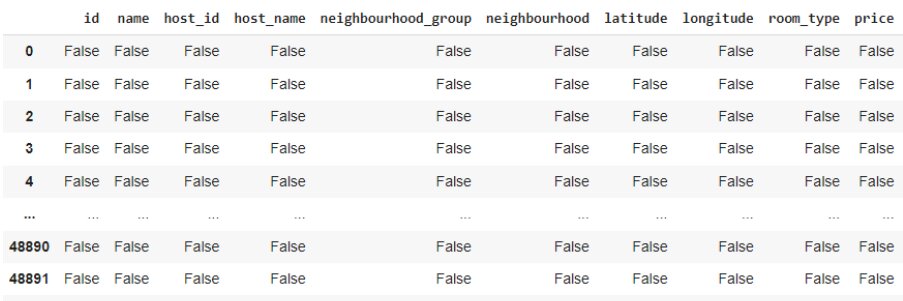
- isnull(): This function displays the dataset with boolean values. False means the value is not null:
df.isnull()
- isna(): This function also displays the dataset with boolean values. False means the value is not N/A:
df.isna()
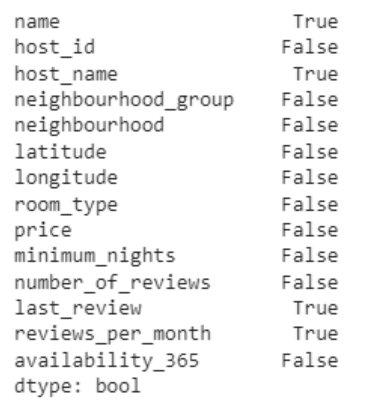
- isna().any(): This function provides the boolean values too but in a columnar format:
df.isna().any()
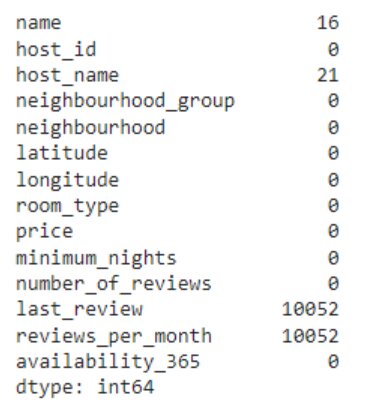
We can see there are 4 columns with null values present: ‘name’, ‘host_name’, ‘last_review’, and ‘reviews_per_month’.
- isna().sum(): This function gives the column-wise sum of the null values present in the dataset.
df.isna().sum()
We can see the number of null values against each of the 4 columns.
Filling the missing values in a DataFrame
- fillna(): This function will replace the null values in a DataFrame with the specified values.
Syntax –DataFrame.fillna(value, method, axis, inplace, limit, downcast)
The value parameter can be a dictionary that takes the column names as key.
Let’s fill in the values for the ‘name’, ‘host_name’, and ‘last_review’ columns:
df.fillna({'name':'Not Stated','host_name':'Not Stated','last_review':0}, inplace=True)
By default, the method does not make changes to the object directly. Instead, it returns a modified copy of our object. This is avoided by setting the inplace parameter.
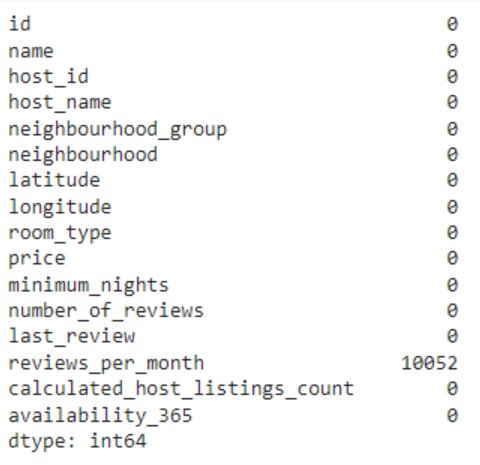
Do you want to check if the null values got filled? Let’s do it using the sum() function for missing values again:
df.isna().sum()
Can you see? We have successfully removed the null values for the 3 columns!
Now, what shall we do about the ‘reviews_per_month’ column?
Dropping columns in a DataFrame
- drop(): This function will remove the columns from the DataFrame.
Syntax –DataFrame.drop(labels=None, axis=0, index=None, columns=None, level=None, inplace=False, errors='raise')
Let’s drop the ‘reviews_per_month’ column:
df.drop(['reviews_per_month'], axis = 1, inplace=True)
Let’s check whether we’ve dropped it:
#Display all column namesdf.columns
We cannot see the ‘reviews_per_month’ column here as it has been successfully removed.
Changing the index of a DataFrame
When dealing with data, it is helpful in most cases to use a uniquely valued identifying field of the data as its index.
In our dataset, we can assume that the ‘id’ field would serve this purpose. So, let’s first check if all the values in this field are unique or not:
df['id'].is_unique
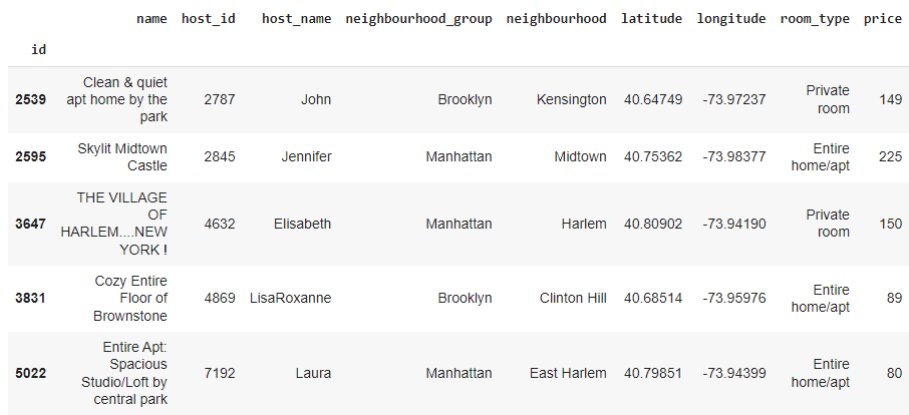
Now that we know that all values in the ‘id’ column are unique, let’s set this column as the index using set_index() function:
df = df.set_index('id', inplace=True)df.head()
You can now access each record directly by using iloc[] as shown:
df.iloc[4]#Displaying the 5th record from the dataset
Renaming Columns of a DataFrame
In many cases, you might require renaming the columns for better interpretation.
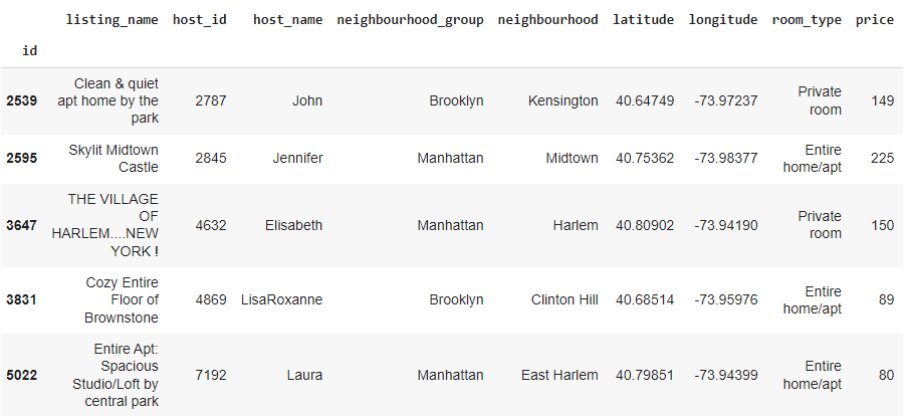
You can do this by using a dictionary, where the key is the current column name, and the value is the new column name:
new_col = {'name':'listing_name', 'number_of_reviews':'reviews'} df.rename(columns=new_col, inplace=True)df.head()
Converting the Data Type of Columns
While checking the DataFrame info() above, we saw that the ‘last_review’ column was of object type. Let’s recall it here:
df['last_review'].dtype.type
Since the column contains dates, we are going to convert its data type to datetime as shown:
df['last_review'] = pd.to_datetime(df['last_review'], format='%Y-%m-%d')df['last_review'].dtype.type
Converting the Data Type to Reduce Memory Usage
You can reduce memory usage by changing the data types of columns.
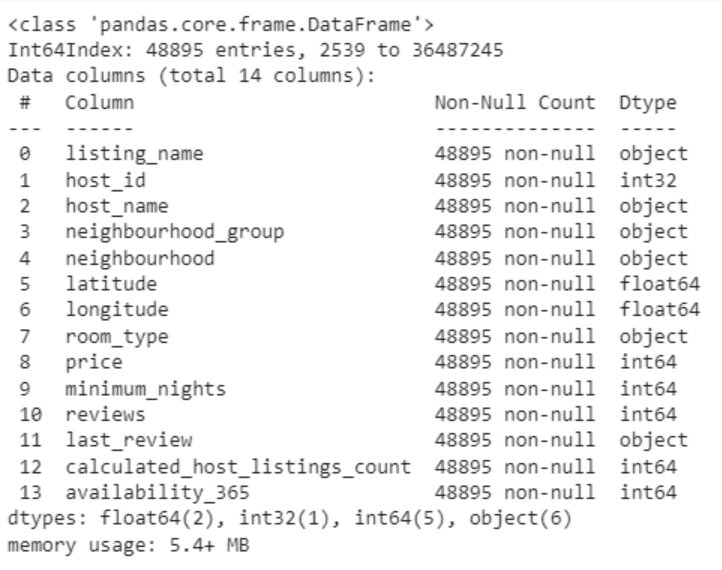
Let’s do it for the ‘host_id’ column. We will convert it from int64 to int32 as shown:
df['host_id'] = df['host_id'].astype('int32')df.info()
So, we have reduced the memory usage from 6+ MB to 5.4+ MB.
Data Cleaning in Pandas – Try it yourself
Click the google colab icon below to run the demo in colab.

Endnotes
Pandas is a very powerful data processing tool for the Python programming language. It provides a rich set of functions to process various types of file formats from multiple data sources. The Pandas library is specifically useful for data scientists working with data cleaning and analysis. If you seek to learn the basics and various functions of Pandas, you can explore related articles here.
———————————————————————————-
This is a collection of insightful articles from domain experts in the fields of Cloud Computing, DevOps, AWS, Data Science, Machine Learning, AI, and Natural Language Processing. The range of topics caters to upski... Read Full Bio


