How to Calculate R squared in Linear Regression
In this article we focussed on R-squared in Linear Regression in which explain the procedure of calculating R squared value in step by step way and with example.
When you have developed a model then, what do you do next? You check its performance metrics like accuracy, F1 score, precision, and recall value. But in the case of linear regression, you check the model performance by the R-square method. You’ve probably heard of the term “r squared” before, but what does it mean? And more importantly, how you can calculate R Squared in Linear Regression.
Don’t worry; we’re here to help!
The R-squared statistic assesses how well a linear regression model fits the data. This blog details the formula, concepts, calculations, and interpretation of the R-squared statistic.
Table of contents
- What is R-squared?
- What is the significance of R squared
- When to Use R Squared
- How to calculate R squared in linear regression?
- Limitations of Using R Squared
- Conclusion
Best-suited Machine Learning courses for you
Learn Machine Learning with these high-rated online courses
What is R-squared?
R squared or Coefficient of determination, or R² is a measure that provides information about the goodness of fit of the regression model. In simple terms, it is a statistical measure that tells how well the plotted regression line fits the actual data. R squared measures how much the variation is there in predicted and actual values in the regression model. We will understand it by example later in this blog.


Also Read: How tech giants are using your data?
Also read:What is machine learning?
Also read :Machine learning courses
What is the significance of R squared
- R-squared values range from 0 to 1, usually expressed as a percentage from 0% to 100%.
- And this value of R square tells you how well the data fits the line you’ve drawn.
- The higher the model’s R-Squared value, the better the regression line fits the data.
Note: R-squared values very close to 1 are likely overfitting of the model and should be avoided.
- So if the model value is close to 0, then the model is not a good fit
- A good model should have an R-squared greater than 0.8.
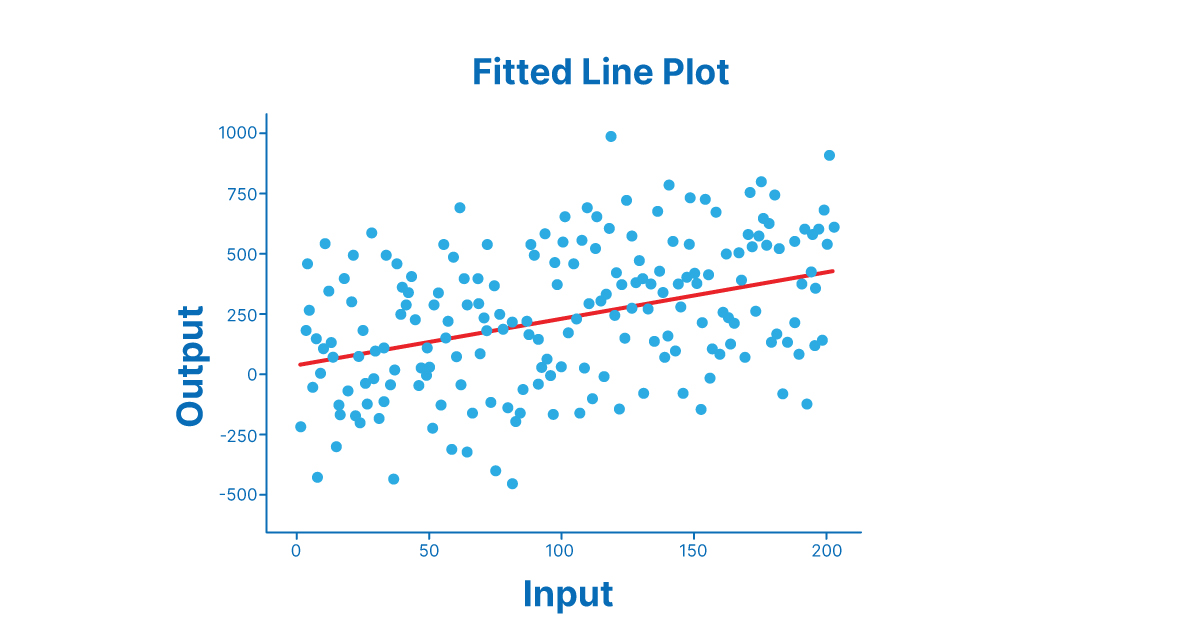
- So if the R squared value is close to 0, then you will get plot like this.
- If the R squared value is close to 1, then you will get plot like this.
- If the R squared value is close to 1, then you will get plot like this.
In this the first image has the data points scattered and away from the regression line, and in this case, the prediction will not be accurate. So this clearly shows R squared value will be less than 0.5 or near 0. In the second image, the values are very close to the regression line, which means the prediction will be good. So the value of R squared will be close to 1.
Note- As the R squared value increases, the difference between actual and predicted values decreases.
Also Read:
- What is the difference between AI vs ML vs DL vs DS
- Application of data science in various industries
When to Use R Squared
Linear regression is a powerful tool for predicting future events, and the r-squared statistic measures how accurate your predictions are. But when should you use r-squared?
- Both independent and dependent variables must be continuous.
- When the independent and dependent variables have linear relationship (+ve or -ve) between them.
How to calculate R squared in linear regression?
Problem Statement:
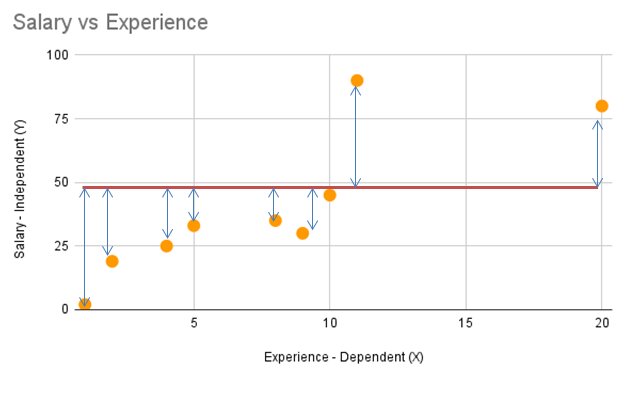
Let’s take a look at an example. Say you’re trying to predict salary based on the number of years of experience. First, You will draw a mean line as shown in fig below.
- Here we have actual values(orange points) and a horizontal/mean line. This line represents the mean of all values of the response variable in the regression model. It is represented on the graph as the average of actual variable values. Now calculate the distance of actual values(all) from the mean line.
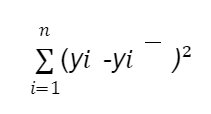
- The deviation of an actual value from the mean is therefore calculated as the sum of the squared distances of the individual points from the mean. This is also called the total sum of squares (SST). SST is also called total error. Mathematically, SST is expressed as:
where yi represents the average(mean) and yi represents the actual value.
- Draw the best line that fits in as shown in fig below.
This straight line is called the regression line or best fit line and has the equation ŷ= mx +c, where ŷ represents the predicted line, c is the intercept, and m is a slope. By using the least square method, we can calculate the slope and intercept.
A least square regression line is a straight line that minimizes the vertical distance from the data points to the regression line.
Explore: Least Square Regression in Machine Learning
For more details you can read: Bias and Variance with Real-Life Examples
- The total variation of the actual values from the regression line is expressed as the sum of the squared distances between the predicted values from the regression line, also known as the Residual sum of squared error (SSR). SSR is sometimes called explanatory error or explanatory variance. Mathematically, SSR is expressed as yi represents the predicted value and yi represents the actual value.
The formula to calculate R squared is:
where:
SSR is the sum of squared residuals (i.e., the sum of squared errors)
SST is the total sum of squares (i.e., the sum of squared deviations from the mean)
Example of R squared
Suppose we have a data set having values of Xrepresenting experience and Y representing salary.
The below data can be represented by this graph in which we have a regression line.
| xi | yi | xi- xi– | yi-yi– | (xi- xi– )2 | (xi- xi– ) ( yi-yi– ) |
| 11 | 90 | 3.22 | 50.11 | 10.38 | 161.47 |
| 10 | 45 | 2.22 | 5.11 | 4.94 | 11.36 |
| 2 | 19 | -5.78 | -20.89 | 33.38 | 120.69 |
| 8 | 35 | 0.22 | -4.89 | 0.05 | -1.09 |
| 4 | 25 | -3.78 | -14.89 | 14.27 | 56.25 |
| 20 | 80 | 12.22 | 40.11 | 149.38 | 490.25 |
| 1 | 2 | -6.78 | -37.89 | 45.94 | 256.80 |
| 9 | 30 | 1.22 | -9.89 | 1.49 | -12.09 |
| 5 | 33 | -2.78 | -6.89 | 7.72 | 19.14 |
| xi– =7.78 | yi– =39.89 | 267.56 | 1102.78 |
Suppose we have a data set having values of X and Y.
1. We have to find Xi(mean) and Yi(mean).
2. Calculate Xi-Xi and Yi-Yi and then do (Xi-Xi)2
3. Now calculate (Xi-Xi)(Yi-Yi)
Now we have to calculate R squared so let’s try to calculate it
| yi^ | yi – yi^ | SSR | yi-yi– | SST |
| 53.17 | 36.83 | 1356.46 | 50.11 | 2511.12 |
| 49.05 | -4.05 | 16.39 | 5.11 | 26.12 |
| 16.07 | 2.93 | 8.56 | -20.89 | 436.35 |
| 37.10 | -2.10 | 4.39 | -4.89 | 23.90 |
| 20.61 | 4.39 | 19.29 | -14.89 | 221.68 |
| 86.56 | -6.56 | 42.97 | 40.11 | 1608.90 |
| 8.24 | -6.24 | 38.98 | -37.89 | 1435.57 |
| 41.22 | -11.22 | 125.82 | -9.89 | 97.79 |
| 24.73 | 8.27 | 68.39 | -6.89 | 47.46 |
| 1681.24 | 6408.89 |
4. Now first we have to calculate yi^ i.e. Predicted value.This column includes predicted values. This predicted value is calculated by using formula y^=mx+c, where m is slope and c is intercept.So now we have to calculate m,which can be calculated by using least squares formula.
5. Find yi-yi^. This value tells us how much the predicted values are away from actual values.
5. Now calculate SSR by using the formula
Where yi represents the predicted value or Y predicted and yi represents the actual value.
Adn SST by using the formula
where yi– represents the average(mean) and yi represents the actual value.
6. Now simply put t it the formula
R-Squared = 1-(SSR/SST). You will get R squared value.We get R square= 0.74,Which shows that the prediction values are somehow close to the actual values
After doing calculation we will get these values
| Slope | 3.068922306 |
| Intercept | 13.46783626 |
Limitations of Using R Squared
- R squared can be misleading if you’re not careful. For example, if you have a lot of noise in your data, your r-squared value will inflate. In other words, it’ll look like your model needs to do a better job of predicting the data when in reality, it’s not.
- R-squared values don’t help in case we have categorical variables.
Are Low R-squared Values Always a Problem?
No! Regression models with low R-squared values can be very good models for several reasons.Some research areas are inherently more unexplained. These ranges have lower R2 values. For example, studies trying to explain human behavior typically have R2 values below 50%. Humans are just harder to predict than physical processes and such. Fortunately, even with low R-squared values and statistically significant independent variables, important conclusions can be drawn about the relationships between the variables. A statistically significant coefficient continues to represent the average change in the dependent variable for a unit shift in the independent variable. Of course, drawing such conclusions is very important.
Conclusion
The Coefficient of determination, more commonly known as R-Squared, is a statistical measure that tells us how much of the variation in a dataset can be explained by our linear regression model. In other words, it tells us how ‘good’ our model predicts the dependent variable, given the independent variable.
FAQs
Are 'Low R-squared Values' always a bad?
No, Regression models with low R squared value can be great in some of the scenarios. Some fields of study have shown greater amount of unexplainable variation. In these areas, R square values are bound to be lower. For example, studies that try to explain human behavior generally have R2 values less than 50%. People are just harder to predict than things like physical processes. Low R square would be bad in the scenarios where one needs relatively precise prediction.
Is a Higher R-Squared Better?
A high or low R-square isn't alwaysu00a0good or bad because it doesn't represent the model's dependability or whether you've picked the correct regression. A good model can have a low R-squared, while a poorly fitted model couldu00a0have a high R-squared, and vice versa in certain scenarios. If the training set's R-squared is higher and the R-squared of the validation set is much lower, then it indicates a case of overfitting. Which is definitely not a good model.
What does R square signify?
R square is a statistical measure which tells us how close the data points are to the regression line. Higher Value of R square signify lesser difference between actual and predicted value. A lower value of R square signify greater difference between actual and predicted value (more error). Higher the value of R square better will be the prediction of the model.
What happens to R-squared when more variables are added?
R square increases every time you add more independent variable to the model.
What is the problem with R square that led to the adoption of Adjusted R Square?
R square value never decreases no matter how many variables you add to your regression model. That is, even if you are adding redundant variables (independent variables with high correlation) to the data, the value of R-squared does not decrease. It either remains the same or increases with the addition of new independent variables. This is not useful as some of the independent variables might not be contributing to the prediction of target variable. This is where Adjusted R Square comes into picture.

Vikram has a Postgraduate degree in Applied Mathematics, with a keen interest in Data Science and Machine Learning. He has experience of 2+ years in content creation in Mathematics, Statistics, Data Science, and Mac... Read Full Bio


Comments
(1)
A
10 months ago
Report Abuse
Reply to Andy