How to Create Group in Tableau
In this article, we will briefly discuss about groups in tableau, how to create groups and finally what are the differences between tableau groups and tableau sets.
Table of Content
- What is a Tableau Group?
- How to Create a Group?
- Edit a Group
- Difference between Group and Sets in Tableau
Best-suited Tableau courses for you
Learn Tableau with these high-rated online courses
What is a Tableau Group?
A tableau group is a set of multiple members combined in a single dimension to create a higher category of dimension.
Confused!!
In simple terms, the Tableau group is a way to combine data in a format that doesn’t exist currently in the data source.
It combines a large number of dimensions members into higher-level categories for easy analysis.
You can create a group of related members in a field.
Example:
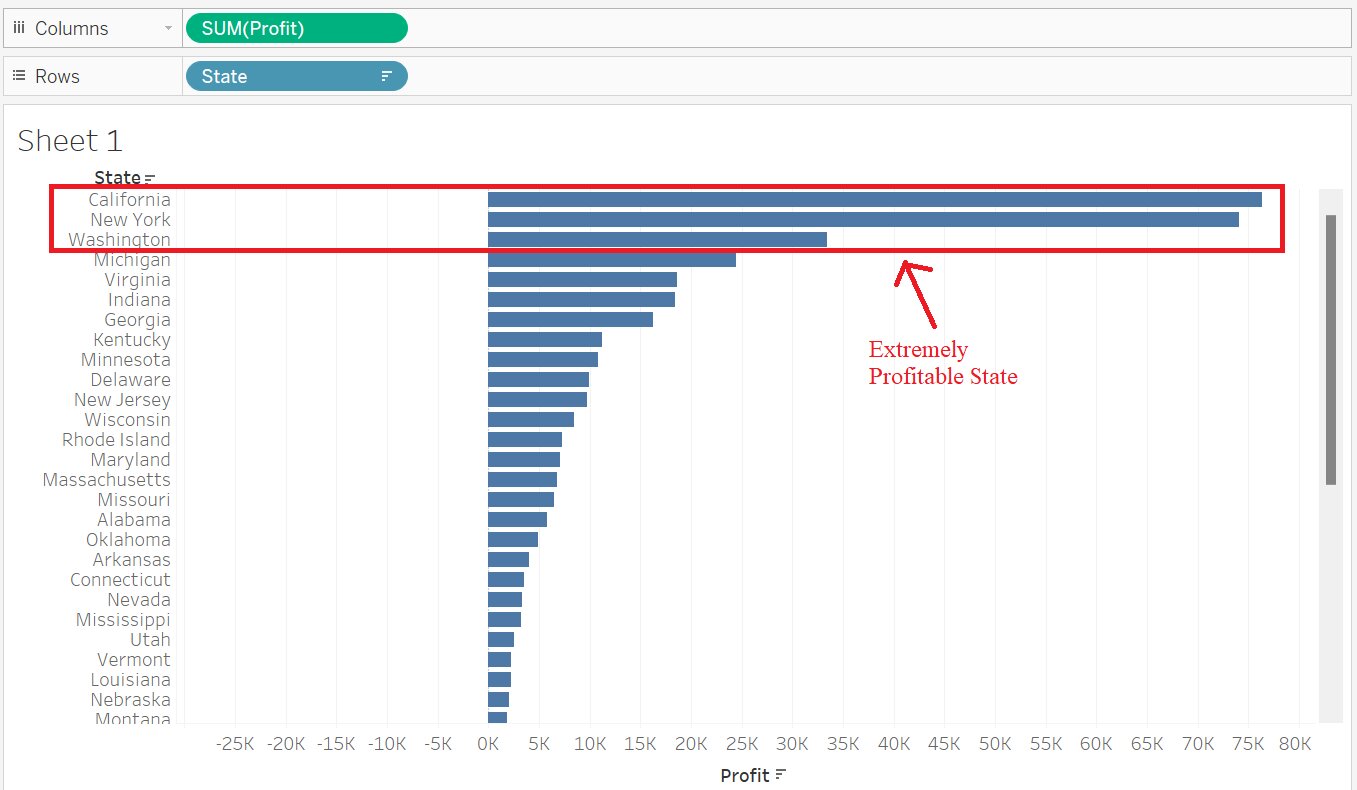
In Samplestore data, if we are working with a view that shows the Sum of Profit by states, we want to group certain states together to create profitable states.
- Loss Making State: -26K < SUM(Profit) < 0K
- Profitable State: 0K < SUM(Profit) < 25K
- Extremely Profitable State: SUM(Profit) > 25K
Note: Groups are are useful for:
- Correcting Data Errors
- Example: In sample store data combining Chico and Chicago into one data point
- Answering “What if” type questions
- Example: In sample store data, What if we combine two categories, Furniture, and Office Supplies, together?
Must Check: What is Tableau?
Must Check: Tableau Online Courses & Certifications
How to Create a Group?
Using the sample store data, we will create a group of extremely profitable states, as mentioned in the above example.
- Loss Making State: -26K < SUM(Profit) < 0K
- Profitable State: 0K < SUM(Profit) < 25K
- Extremely Profitable State: SUM(Profit) > 25K
Using the Data Pane
- Connect to Sample Superstore data
- Drag and drop State and Profit into column and row shelf, respectively
- Sort the data (in descending order)
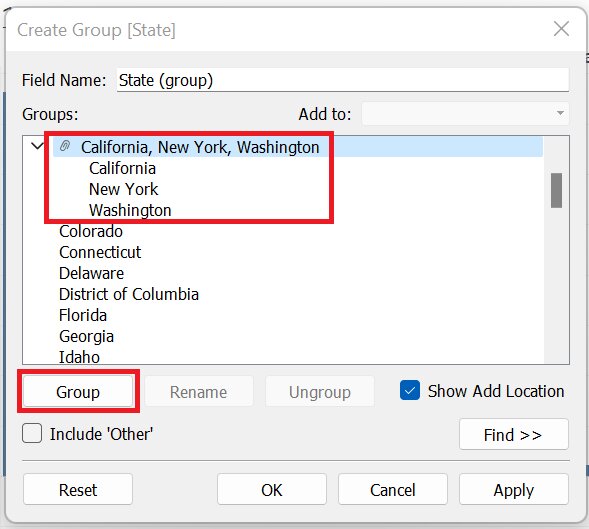
- Right-click on dimension (State) -> Create -> Group
- Create Group dialog box will appear
- List of the element will appear (here, a list of all states)
- Select the states ( California, New York, and Washington) using Ctrl + Click
- You can search the elements using the Find option at the bottom of Create Group dialog box
- Select Group
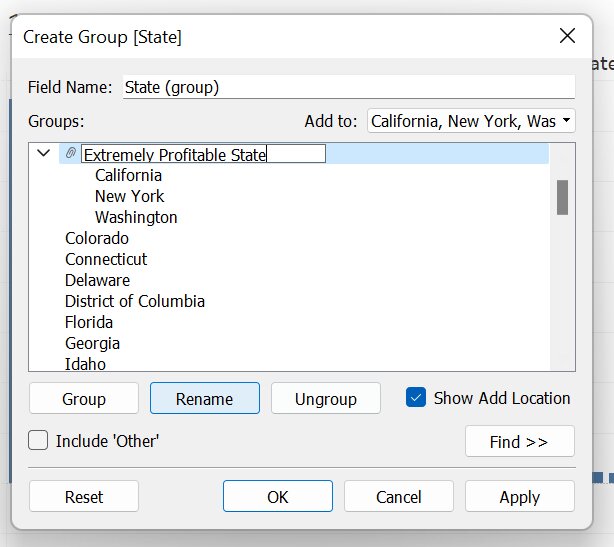
- You can Rename the Group
- Here, change the group name to Extremely Profitable State
- Click OK


Using the View
Using the View, we can create the group (Extremely Profitable State) using two methods:
Method-1:
- Select the list of all the elements that are required for Group using Ctrl + Click
- Here, we will select the state California, New York, and Washington for Extremely Profitable State
- Click the Group icon on the toolbar
Method-2:
- Select the list of all the elements that are required for Group using Ctrl + Click
- Here, we will select the state California, New York, and Washington for Extremely Profitable State
- Right-click on highlighted elements
- Select Group
Edit a Group
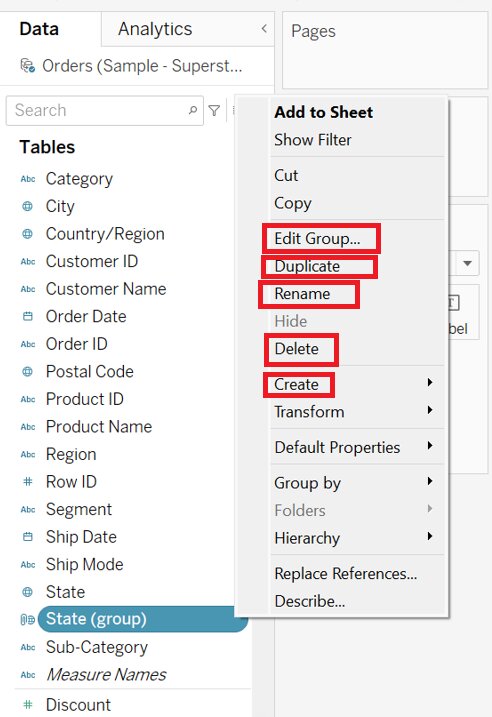
After the Group is created, it will be displayed in the data pane, from where you can rename the Group and add or delete members from the Group. Or create a new Group too by just simply right-click on the Group name in the data pane.
- To add a member to an existing group
- Right-click on the Group from the data pane -> Edit Group
- Edit Group dialog box will appear
- Select one or more members and drag them into the required Group
- Click OK
- To delete a member from an existing group
- Right-click on the Group from the data pane -> Edit Group
- Edit Group dialog box will appear
- Select one or more members, and then click Ungroup
- Click OK
Difference between Groups and Sets in Tableau
Now, you are in the position to answer what is set, how to create them, and how to edit them once Group is created, but I’m sure you are also confused that we do similar things with the sets too.
So, what is the difference between Sets and groups in Tableau?
| Group | Set |
| You can group only within one dimension | You can group across multiple dimensions |
| Groups are not dynamic. | Sets are dynamic (i.e., when data changes, the set will update with it) |
| New created Group will appear in the same dimension window. | The newly created set appears in a separate window below the measure. |


In this article, we will discuss one of the important concepts...read more
Conclusion
In this article, we have discussed about groups in tableau, how to create groups and finally what are the differences between tableau groups and sets.
Hope this article will help you in your data analysis journey.
Top Trending Articles:
Data Analyst Interview Questions | Data Science Interview Questions | Machine Learning Applications | Big Data vs Machine Learning | Data Scientist vs Data Analyst | How to Become a Data Analyst | Data Science vs. Big Data vs. Data Analytics | What is Data Science | What is a Data Scientist | What is Data Analyst


