Introduction To Tableau
This article is one of the first blogs of the complete tutorial of Tableau, focusing on Tableau Certificate analysis and tableau desktop specialist. Through a series of articles, we will cover all the topics in-depth with examples.
“A picture is worth of thousand words”
Introduction
This article is one of the first blogs of the complete tutorial of Tableau, focusing on Tableau Certificate analysis and tableau desktop specialist. Through a series of articles, we will cover all the topics in-depth with examples.
In the article, Introduction to Tableau we will introduce data visualization tools Tableau, its features, products, advantage and disadvantage.
Now, let’s deep dive into the data visualization tools.
Best-suited Tableau courses for you
Learn Tableau with these high-rated online courses
Table of Content
Data Visualization
Data visualization is the graphical representation of the information and data.
By using visualization elements like charts, graphs and maps, data visualization tools provide an accessible way to see and understand trends, outliers and patterns in data.
Data Visualization tools and technologies are essential to analyze massive amounts of information and make data-driven decisions.
Elements like graphs, maps make the visualization of complex data more comfortable in comparison to spreadsheets and reports.
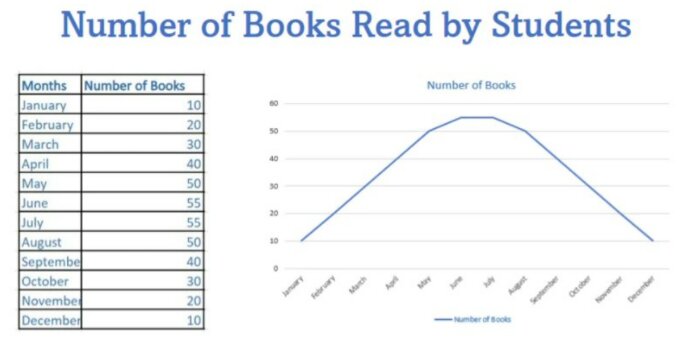
Let’s understand the importance of data visualization by a very simple example.
In the above figure, we have the record of the number of books issued monthly in a particular year in the form of a table and graph.
The graph gives a clear interpretable picture of the records in spite of checking every record row and column through the table.
Data Visualization Tools
There are some data visualization tools that help to visualize the data quickly and interactively.
Some famous Data Visualization tools are:
- Tableau
- Excel
- PowerBI
- Plotly
- Google Charts
- Zoho Reports
Now, we will briefly discuss, Tableau: A data visualization tool.
Tableau
According to Tableau.com:
Tableau is a visual analytics platform transforming the way we use the data to solve problems empowering people and organizations to make most of their data.
Bit confused, let’s understand in simple terms
In layman’s terms,
Data visualization is the process of describing information through visual rendering.
Tableau is the fastest growing, powerful and most popular data visualization and business intelligence tool that allow us to analyze trends visually and take quick decision.
It helps to create interactive graphs and charts in the form of dashboards and worksheets to gain insights by just simple drag and drop of the features.
Tableau Products
Depending on the different business uses, Tableau offers different tools (tableau products )
- Tableau Desktop
- Allows to code and customize reports
- Establish connectivity between data warehouse and other various types of files for live data analysis
- Tableau Server
- It has very high security
- Beneficial for quick and effective sharing data
- Tableau Online
- Similar to tableau server, but data is stored on servers that are hosted on clouds
- No storage limit on data which are published in Tableau Online.
- Tableau Reader
- Tableau Reader is a free tool that allows us to view the visualizations and workbooks
- No security in Tableau Reader as anyone can view the workbook using Tableau Reader.
- Tableau Public
- Built for cost-effective users
- Best for those who want to share their data with the general public
Features of Tableau
- Fast Analytics
- Connect and visualize with data in minutes.
- 10 to 100 times faster than other visualization tools
- Ease of Use/ Easy to Understand
- No Programming required
- Analyze data by simple drag and drop
- Smart Tableau Dashboard
- Combine multiple views of data to get more effective insights
- Update Automatically
- Automatic update on the scheduled time
- Connect with any type data source
- Publish the data with the few clicks to share it live on the web and mobile devices
Advantage and Disadvantage
| Advantage | Disadvantage |
| Mobile-Friendly | High-Cost |
| Drag and Drop functionalities | No custom visual reports |
| Ease of use | Manual parameter updating |
| Handle a large amount of data without compromise on performance | Poor handling of screen resolution |
| Multi-device support | Poor custom formatting |
Conclusion
In the article, Introduction to Tableau we discussed data visualization, tools of data visualization and briefly introduced tableau which is one of the data visualization tools with its feature, tools, advantages and disadvantages.
Hope this article will help you in your data analyst journey.
This article is a part of a complete tutorial of Tableau, focusing on Tableau certified data analysts and tableau desktop specialists.
Through a series of articles, we will cover all the topics in-depth with examples.
Top Trending Articles:Data Analyst Interview Questions Data Science Interview Questions Machine Learning Applications Big Data vs Machine Learning Data Scientist vs Data Analyst How to Become a Data Analyst Data Science vs. Big Data vs. Data Analytics What is Data Science What is a Data Scientist What is Data Analyst


