Measures of Dispersion: Range, IQR, Variance, Standard Deviation
Introduction:
To describe the data, a measure of the central tendency is not just enough as it only gives information about the central values of the dataset.
It may be possible that the mean of the two datasets is equal but they are entirely different datasets.
In this article, we will discuss Measures of Dispersion.
Table of Content
Best-suited Statistics for Data Science courses for you
Learn Statistics for Data Science with these high-rated online courses
Dispersion
Dispersion or variability describes how items are distributed (scattered) from each other and the center of a distribution.
Example: Height of students
In statistics, dispersion helps to understand the distribution of the data.
Measures of Dispersion
Statistical methods that help to know about the distribution or the spread of the data points in the datasets are known as Measures of Dispersion.
There are 4 methods to measures the dispersion of the data:
- Range
- Interquartile Range
- Variance
- Standard Deviation
Range
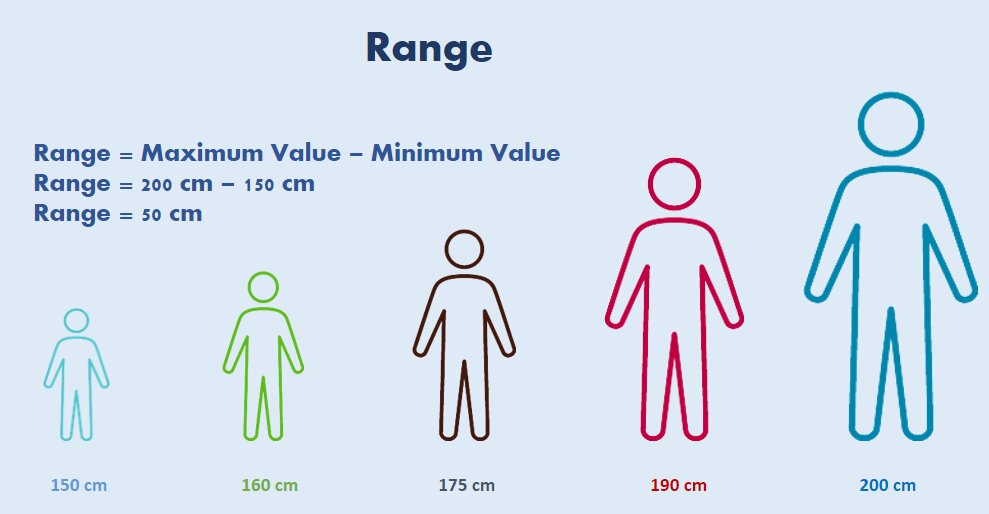
The range is the easiest measure of dispersion. It is simply calculated by subtracting the highest value from the lowest value.
Range = Highest Value – Lowest Value
Let’s understand this by an example:
Problem Statement:
Let there be 5 students in the class having heights of 150cm, 160cm, 175cm, 190cm and 200 cm.
Calculate the range of heights?
Range = 200cm – 150cm
Hence, Range = 50cm
Before defining the interquartile range, let’s discuss the quartiles and five-number summary
Quartiles: Quartiles divide the set into 4 equal parts.
There are three quartiles Q1, Q2 and Q3, where Q2 is the median of the distribution.
Five number summary:
Every dataset can be described using these 5 numbers
- Lowest value
- Q1: 25 percentile
- Q2: Median
- Q3: 75 Percentile
- Highest Value
Interquartile Range
Interquartile Range: Interquartile range is defined as the range between 75 percentile (Q3) and 25 percentile (Q1).
IQR = Q3 – Q1
Let’s understand Q1, Q2, Q3 and the Interquartile range by an example.
Problem Statement:
Let there are 8 numbers between 10 and 90 which are equally distributed.
Define the five-number summary and find the Interquartile Range?
- Lowest value : 10
- Q1 (25 percentile) : 25
- Q2 (50 percentile) : 50
- Q3 (75 percentile) : 75
- Highest value : 90
- Interquartile Range(IQR) = Q3 – Q1 = 75 – 25 = 50
Interquartile Range = 50
Variance
- defined as the average of squared difference from the mean.
- measures how far each data point in datasets from the mean.
To know more about the mean, read the article on Measures of Central Tendency.
Formula:
Population variation:
Sample Variation:
To know more about Population and Sample, read the article.
Standard Deviation
Standard deviation is the square root of the variance.
Formula:
Population Standard Deviation
Sample Standard Deviation
Now, let’s understand both by an example,
Problem Statement:
Let there be 5 students of height 1m, 2m, 3m, 4m and 5m.
Calculate the Standard Deviation.
Note: A lower Standard Deviation indicates data points in datasets are dense near the mean.
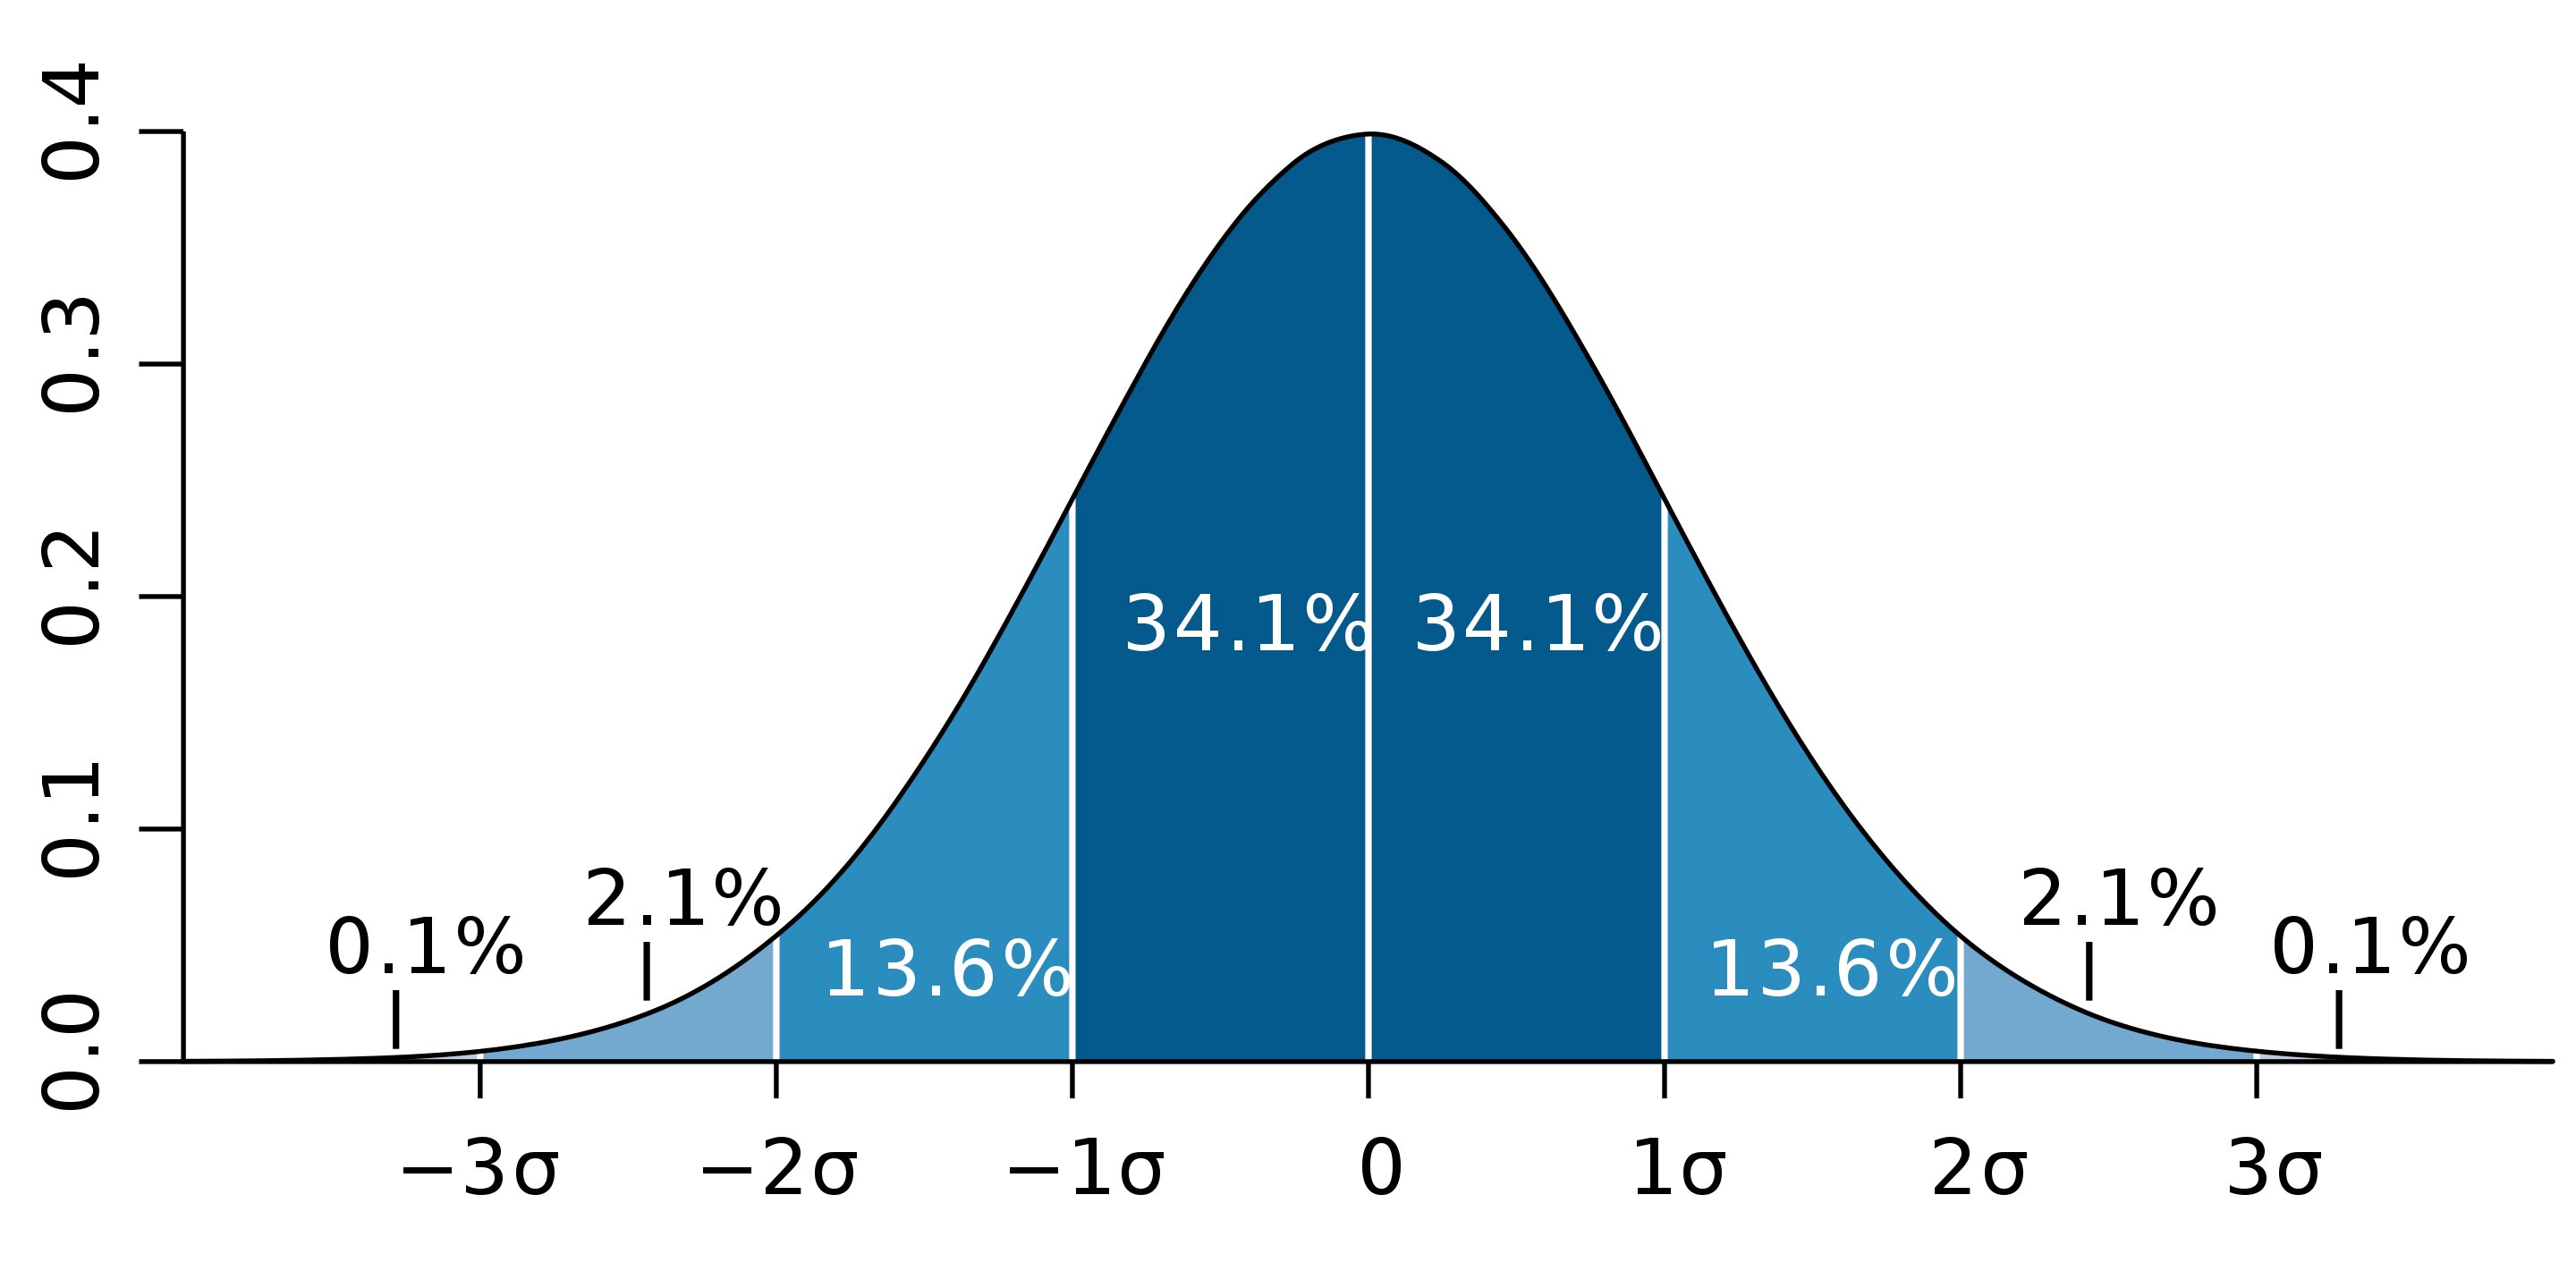
In a normal distribution,
- 68% of value lies in 1st Standard Deviation
- 95% of value lies in 2nd Standard Deviation
- 99.7% of value lies in 3rd Standard Deviation
To read more about Normal Distribution, read the article on Probability Distribution.
Which measure of dispersion is the best?
Standard Deviation is considered as the best measure of dispersion as,
- Help to make comparison between the distribution of two or more different datasets
- Based on all values
- Capable of further algebraic treatment
Conclusion
In this article we briefly mention the Measures of Dispersion: with an example. Hope this article help in understanding the concepts easily.
————————————————————————————————————–
If you have recently completed a professional course/certification, click here to submit a review.
Frequently Ask Question (FAQ)
Ques 1. What is Dispersion?
Ans 1. Dispersion or variability describes how items are distributed (scattered) from each other and the center of a distribution.
Example: Height of students
Ques 2. What is Measure of Dispersion?
Ans 2. Statistical methods that help to know about the distribution or the spread of the data points in the datasets are known as Measures of Dispersion.
There are 4 methods to measures the dispersion of the data:
- Range
- Interquartile Range
- Variance
- Standard Deviation
Ques 3. Which measure of dispersion is best?
Ans 3. Standard Deviation is considered as the best measure of dispersion as,
- Help to make comparison between the distribution of two or more different datasets
- Based on all values
- Capable of further algebraic treatment
Top Trending Articles in Statistics:
Skewness In Statistics | Statistics Interview Question | Basics Of Statistics | Measure Of Central Tendency | Probability Distribution | Inferential Statistics | Measure Of Dispersion | Introduction To Probability | Bayes Theorem | P-Value | Z-Test | T-Test | Chi-Square Test | Outliers In Python | Sampling and Resampling | Regression Analysis In Machine Learning | Gradient Descent | Normal Distribution | Poisson Distribution | Binomial Distribution | Covariance And Correlation | Conditional Probability | Central Limit Theorem
FAQs
What is Dispersion?
Dispersion or variability describes how items are distributed (scattered) from each other and the center of a distribution. Example: Height of students
What is Measure of Dispersion?
Statistical methods that help to know about the distribution or the spread of the data points in the datasets are known as Measures of Dispersion. There are 4 methods to measures the dispersion of the data: 1. Range 2. Interquartile Range 3. Variance 4. Standard Deviation
Which measure of dispersion is best?
Standard Deviation is considered as the best measure of dispersion as, 1. Help to make comparison between the distribution of two or more different datasets 2. Based on all values 3. Capable of further algebraic treatment


Comments
(1)
L
11 months ago
Report
Reply to Lucifer Morning star