Model Deployment using Streamlit Library
Deploying the model is a crucial step and oftentimes requires a lot of setup. In this article, we will be using the streamlit library to deploy our models.
By Sameer Jain
A Data Scientist often struggles to let his/her clients describe the model and tell them how to use the model to generate predictions. Oftentimes clients want a simple and easy to interact solution to generate results. Let us see how we can use the streamlit library to deploy our models.
Introduction to Streamlit
It is a python library to create machine learning applications with ease and quickly. The library supports general web development functions and also allows you to use other libraries. It allows data scientists to create web applications in just a matter of hours.
Best-suited Machine Learning courses for you
Learn Machine Learning with these high-rated online courses
Why Streamlit?
The best reason to use streamlit library is that it is really easy to create and deploy machine learning apps. It also supports hot-reloading i.e. as you make changes to the file, streamlit will update the application accordingly. The framework is designed easily so that you won’t have to spend hours learning just how to use it. In this article, we will train, test, and deploy our model using streamlit library. We will use the Spotify music data set for this.
About the Data
The data has the following features:
- acousticness: A measure from 0 to 1 to determine the track is acoustic or not.
- available_markets: Country codes where the track is available.
- danceability: Rythmic score from 0-1 which determines how easier is it is to dance.
- energy: Amount of energy in the track from 0-1.
- instrumentalness: Instrumentalness of the track.
- key: Track key value.
- liveness: Quality of track from 0-1.
- loudness: Higher the value louder the track.
- name: Name of the track.
- popularity: Track popularity score.
- preview_url: Preview link of the track.
- speechiness: Amount of vocals in the track.
- tempo: Tempo of the track.
- time_signature: Length of the track in minutes.
- valence: Positivity score of the track.
We will be using the data to define clusters and analyze each cluster. So, let’s get started:
Getting Started with streamlit library
To install streamlit, you can use the following pip command on the console:
pip install streamlit
To get started, just create an empty python file as main.py and paste the below code:
import streamlit as st

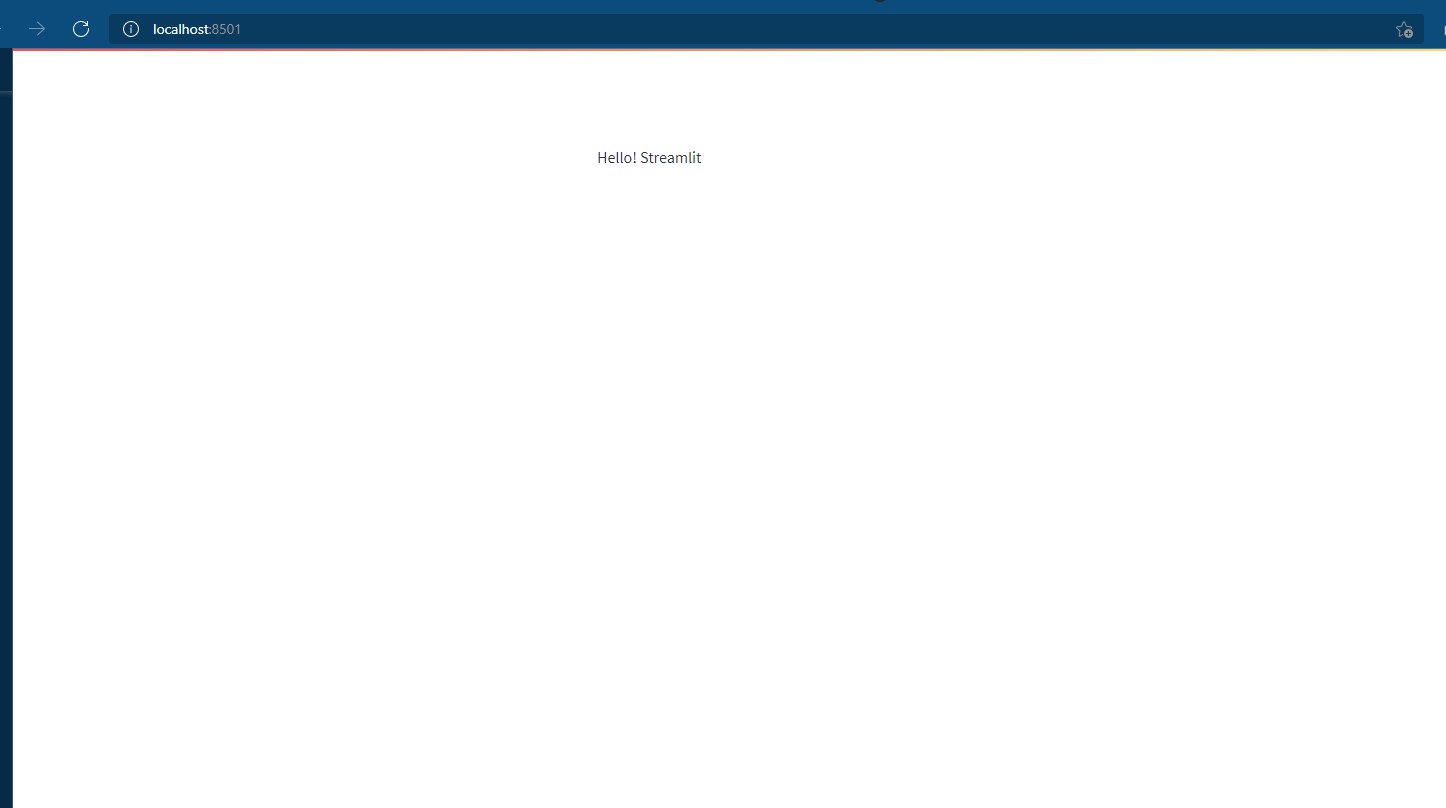
st.write("Hello! Streamlit")
- Open the command prompt
- Navigate to the file
- Finally, run the below command:
streamlit run main.py
Your browser will open with the following output:
See how easy it is to get you application running. Now, lets make changes to the applications add components to it.
Streamlit Elements
st.write
“The swiss army knife of streamlit commands” : streamlit documentation
The function can be used to display dataframe, text, images, and charts as well. For a newbie, the functions are a godsend. You can do anything with this, but it also comes with some limitations of its own as the slot cannot be reused for other purposes. Once you declare it will stay like that forever.
Let’s try to read the data using the function:
st.write(data.head())
For more information on st.write visit the official documentation from here.
Text Elements
Streamlit library has following text functions:
- markdown(): supports markdown input.
- title(): Every streamlit app has a single title.
- header(): Text header with some formatting.
- subheader(): Text sub-header with some formatting.
- caption(): To be used for captions, footnotes or some explaining.
- code(): Displays code in formatted way.
- text(): Simple text function.
- latex(): Supports latex.
While we have st.write() method that does all but it is quite important to have a clean code structure that is why the above functions are defined. To use header or markdown, you can just put the markdown string inside the functions like below:
st.title("Spotify Tracks Clusters")
st.header("About the data")
st.markdown('''
The data has following features:
- __acousticness__: A measure from 0 to 1 to determine the track is acoustic or not.
- __available_markets__: Country codes where the track is a available.
- __danceability__: Rythmic score from 0-1 which determines how easier is it to dance.
- __energy__: Amount of energy in the track from 0-1.
- __instrumentalness__: Instrumentalness of the track.
- __key__: Track key value.
- __liveness__: Quality of track from 0-1.
- __loudness__: Higher the value louder the track.
- __name__: Name of the track.
- __popularity__: Track popularity score.
- __preview_url__: Preview link of the track.
- __speechiness__: Amount of vocals in the track.
- __tempo__: Tempo of the track.
- __time_signature__: Length of the track in minutes.
- __valence__: Positivity score of the track.''')
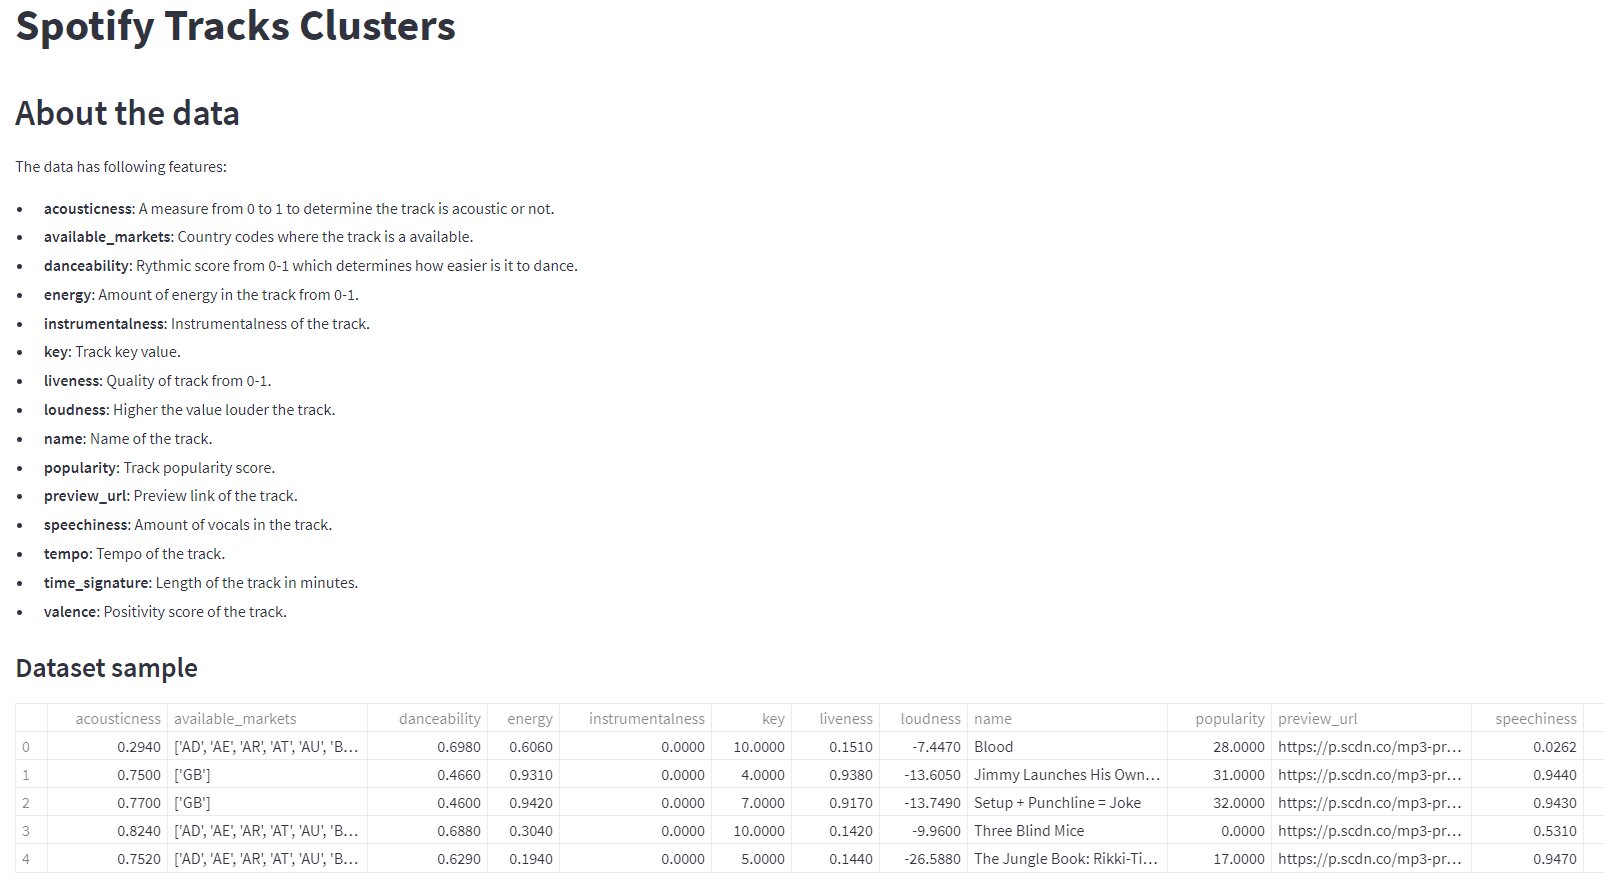
st.subheader('Dataset sample')
st.write(data.head())
The output of the above code will be
You can use st.write() to display data frames but there are other functions as well to display tables:
- dataframe(): Displays simple dataframe.
- table(): Displays static table.
- metric(): Displays metric in bold format.
- json(): Pretty printed json.
Chart Elements
With streamlit library you can plot pydeck, plotly, bokeh, vega lite, and altair plots. It also provides some simple native plots like line charts and area charts. In this article, we will be focusing on plotly charts. Let’s try to gain some insights on the data:
gcat=data.groupby(['time_signature']).popularity.mean().reset_index()
fig=px.bar(gcat,x=gcat.index,y=gcat.popularity)
st.plotly_chart(fig)
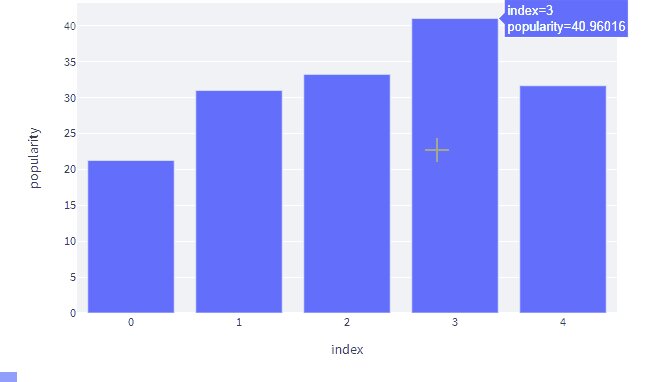
The output will be:
As you can see tracks with a time signature of 3 minutes are most famous.
You can add more interactivity into the same plot using streamlit. You can compare different time signatures for multiple parameters like liveliness, danceability, and so on.
Input Widgets
Streamlit supports several input widgets like buttons, sliders, checkboxes, date inputs and text input values. Let’s add a dropdown to make the above plot much more interactive:
colb=st.selectbox('Select column name to compare:',['acousticness', 'danceability', 'energy',
       'instrumentalness', 'liveness', 'loudness',
       'popularity', 'speechiness', 'tempo', 'valence'],6,lambda x:x.capitalize())
gcat=data.groupby(['time_signature'])[colb].mean().reset_index()
fig=px.bar(gcat,x=gcat.index,y=gcat[colb],color=gcat[colb]
            ,color_continuous_scale='greens')
fig.layout.coloraxis.colorbar.title = colb.capitalize()
fig.update_layout( xaxis_title="Time Signature",
    yaxis_title=colb.capitalize(),
    font=dict(family="Courier New, monospace",
        size=12,color="#56ab91"
    ))
st.plotly_chart(fig)
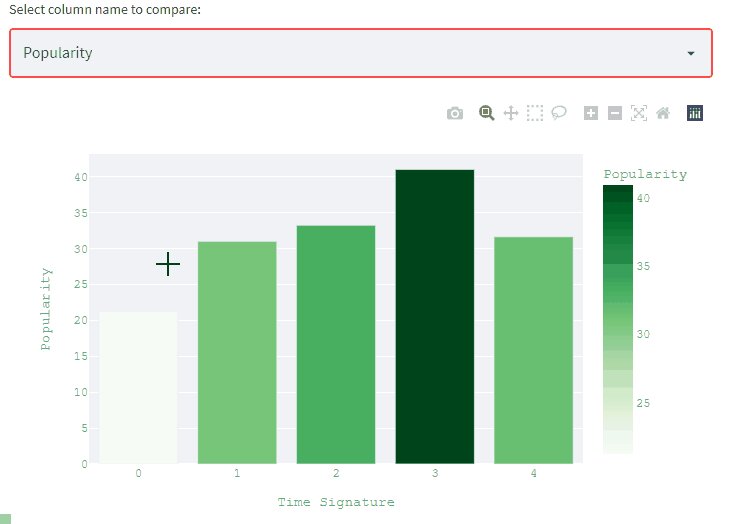
The output will be:
Selectbox takes label name, list of options as required arguments. While rest of the arguments are up to the user like format_func which is applied over each item of the list.
There are many more methods and widgets to explore in streamlit. You can check the official documentation for further exploration.
Training Model
We will be training model and in jupyter notebook. After training, we will pickle the model to be deployed.
As you can see that data needs to be scaled down and outliers to be removed for better training. We will scale the data and remove outliers before training the model.
# Removing outliers using scipy stats model_data=model_data[(np.abs(stats.zscore(model_data)) < 3).all(axis=1)] # Scaling model data scaler = StandardScaler() scaled_data = scaler.fit_transform(model_data)
After scaling, we will fit the data using PCA and train the model:
pca.n_components = 2 # we will use 2 components to plot the data reduced_data = pca.fit_transform(scaled_data) reduced_data = pd.DataFrame(reduced_data,index=scaled_data.index) max_cluster_count=24 def kmeans_cluster(num_clusters,reduced_data): kmeans = KMeans(n_clusters=num_clusters) kmeans.fit(reduced_data) z = kmeans.predict(reduced_data) return kmeans, z inertias = np.zeros(max_cluster_count) for i in tqdm(range(1, max_cluster_count+1)): kmeans, z = kmeans_cluster(i,reduced_data) inertias[i-1] = kmeans.inertia_
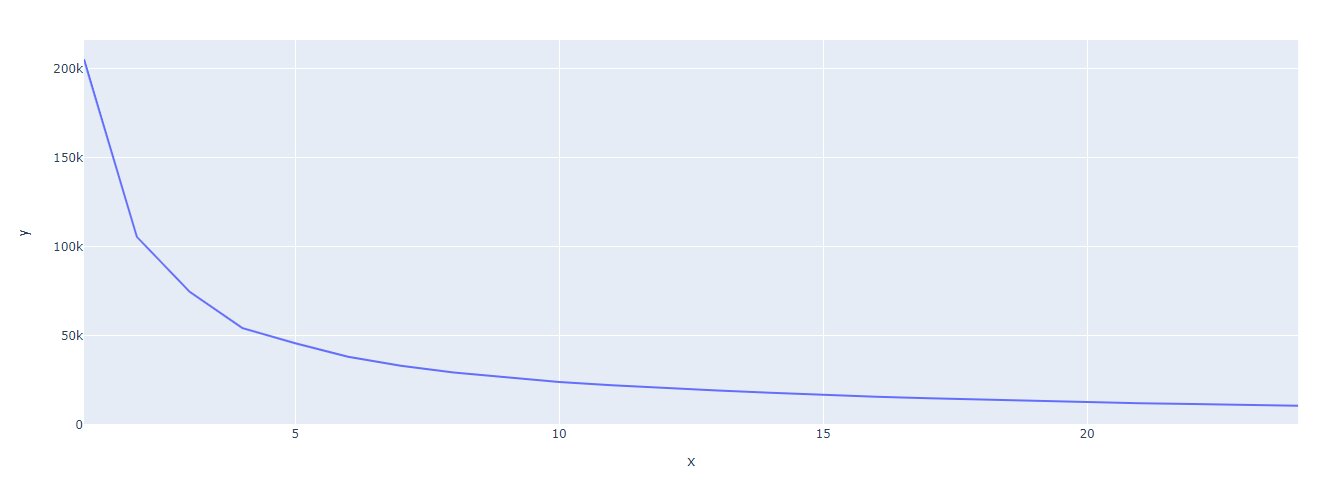
Let’s plot the elbow plot to determine the value of K:
We will use 5 as K value for now and finalize the model. After that we have to pickle the important data:
pickle_data={'model':model,'pca':pca,'scaler':scaler}
with open('pickle_data.pk','wb') as f:
    pickle.dump(pickle_data,f)
Deployment
Now we have all the things we require in place to deploy our app. We will see how to deploy the streamlit application using the following services:
- Streamlit library sharing
- Heroku
- Ngrok
Streamlit Sharing
Streamlit provides a sharing service to deploy streamlit applications. You can deploy your applications for free from your GitHub account. Before pushing your web app to GitHub ensure that you have defined your requirements file:
numpy==1.21.1
pandas==1.3.5
plotly==4.14.3
pycountry-convert==0.7.2
streamlit==1.4.0
scikit-learn==0.23.2
For this project, the above are the requirements to successfully run the application. Once you have checked that your streamlit application is running online you can now create a GitHub repository and push all the required files.
After pushing the files to GitHub, visit share.streamlit.io and create an account. Connect your GitHub account and then, click on the new app to add your application:
Select the repository, branch and give the main file name with extension. After that, click on Deploy! And you are done. Once all the dependencies are installed, your application will automatically load:
You can check out the deployed application for this project from here.
Heroku
To deploy your application on Heroku you will have to add two more files before pushing on onto GitHub.:
- setup.sh
The file will contain the shell script to create the .streamlit folder:
mkdir -p ~/.streamlit
echo "[server]
headless = true
port = $PORT
enableCORS = false
" > ~/.streamlit/config.toml
- Procfile
Every Heroku application will have a Procfile with the name Procfile without any extension. The file should always be at the root directory of your application. The format it follows is:
<process type>: <command>

<process type> defines the type of application you are going to deploy like web, worker, clock, and so on.

<command> The command that will get executed at first to start your application.
For our web application we will keep the following:
web: sh setup.sh && streamlit run main.py
After creating all the required files and pushing them to GitHub, we can start the deployment.
- First, go to https://dashboard.heroku.com/ and click on new -> Create new app:
- After that give name to your application and region click on create app.
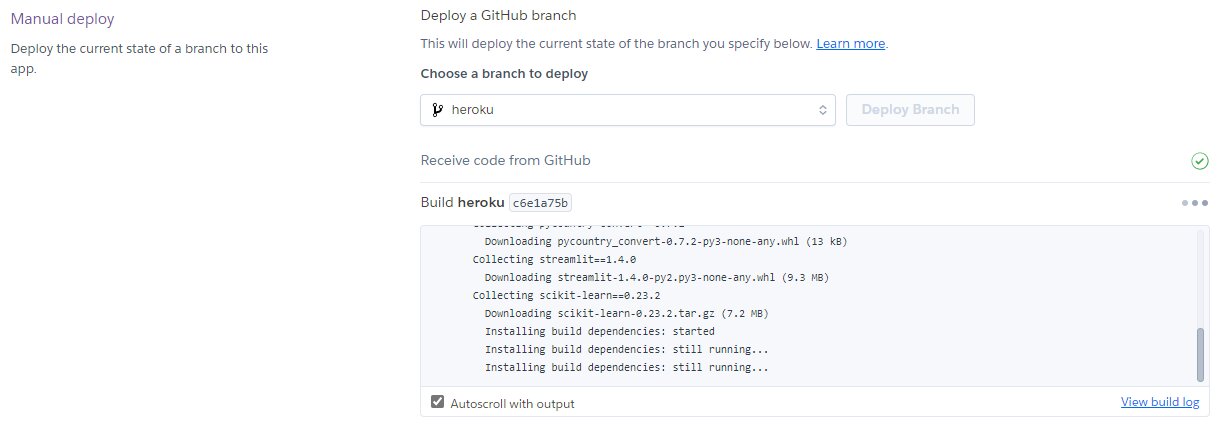
- After that connect your GitHub account and choose the correct repository and branch:
- At the end click on Deploy to Heroku. Wait for the Heroku to build the dependencies and you are done.
You can check the current application from here.
Ngrok
This tool is really helpful to showcase your prototype application to clients. You don’t have to deploy the complete application with this tool. Even you don’t have to wait for the client’s feedback and re-deploy the application with the changes. With this tool, you can expose your local server to the client and makes changes before you finally deploy the application. Just create a free account on ngrok from here and install the application on your system. Once installed, you just have to put your auth token on the system which can be taken from: https://dashboard.ngrok.com/get-started/setup
After you are done with your setup you will have to just write one single command:
ngrok http ngrok http https://localhost:8501
Now, you can share the highlighted link to your client for reviewing the application.
Conclusion
Streamlit is a strong tool to have in your arsenal. It allows you to easily deploy your machine learning models with ease and in an elegant fashion. In this article, we have learned how to create and deploy streamlit applications. You can try all the options given by streamlit to create your application cleaner and more intuitive.
_______________
Recently completed any professional course/certification from the market? Tell us what you liked or disliked in the course for more curated content.
Click here to submit its review with Shiksha Online.
This is a collection of insightful articles from domain experts in the fields of Cloud Computing, DevOps, AWS, Data Science, Machine Learning, AI, and Natural Language Processing. The range of topics caters to upski... Read Full Bio


