Multivariate Analysis Techniques for Data Exploration
Multivariate analysis is a statistical method that involves analyzing multiple variables. It helps to determine relationships and analyze patterns among large sets of data. Learn about multivariate analysis techniques and how they can be used to make predictions for achieving business goals.
The evolution of information technology and data analytics has made it easier to make collection, storage and transportation processes of large databases (both in volume and complexity). A multivariate analysis approach helps to highlight and understand the inter interrelatedness between and within sets of variables. Let us understand more about multivariate analysis and its techniques in detail.
Must Explore – Statistics for Data Science Online Courses & Certifications
What is Multivariate Analysis?
Multivariate analysis is a technique used to analyze multiple variables simultaneously. Its goal is to find patterns, relationships, and associations between variables. In contrast to univariate analysis, which focuses on a single variable, multivariate analysis examines the interaction between multiple variables.
Multivariate analysis is primarily a mathematical approach to decision-making. It has many applications, including problems in engineering, traffic management, biology, economics, marketing, and even ethics and behavioral psychology. You can quantify how changes in one or more areas of a complex problem affect an outcome over time and indicate whether those changes will alleviate or exacerbate a problem.
Must Read – Statistical Methods Every Data Scientist Should Know
Best-suited Statistics for Data Science courses for you
Learn Statistics for Data Science with these high-rated online courses
Multivariate Analysis Process Explained using an Example
Let’s take a student dataset that contains information about marks obtained by students in different subjects, the number of hours they studied, and their overall GPA. Multivariate analysis would help you understand these variables’ relationships and uncover insights.
Example: Analyzing the Performance of Students
Variables:
- Test Score in Math
- Test Score in English
- Test Score in Science
- Number of Hours Studied
- Overall GPA
Problem Statement: Explore how the variables (test scores and study hours) are related and how they collectively affect a student’s overall GPA.
Steps:
- Data Collection: This process would involve collecting data from a sample of students, recording their test scores in different subjects, the number of hours they study, and their overall GPA.
- Data Exploration: Descriptive statistics and visualization techniques can be used to understand the distribution of each variable. These techniques allow you to understand your data’s attributes, identify potential outliers or unusual patterns, and uncover initial insights.
- Correlation Analysis: The next step is calculating the correlation coefficients between pairs of variables to understand the strength and direction of linear relationships between variables. For instance, you can find out if there’s a correlation between study hours and test scores.
- Regression Analysis: Performing multivariate regression analysis to predict the overall GPA based on the test scores in different subjects and the number of hours studied. This analysis will provide you with coefficients that indicate the impact of each variable on the GPA while controlling for the effects of other variables.
- Data Interpretation: Based on the regression results, interpret the coefficients. For example, the number of hours studied has a positive coefficient, suggesting that more study hours are associated with a higher GPA. You can also determine which test scores strongly influence the GPA.
- Data Visualization: Create visualizations like heat maps or 3D plots to show the combined effect of multiple variables on the overall GPA. This can help in understanding the complex relationships in the data.
- Result Analysis: Summarize your findings and insights, analyze how each variable contributes to a student’s GPA, and how these variables interact.
I hope this example helped you to understand how multivariate analysis helps to determine the relationships between multiple variables (test scores, study hours, and GPA) and how they collectively contribute to the outcome of interest (GPA).
Types of Multivariate Analysis Techniques
Multivariate methods can be subdivided according to different aspects.
Factor Analysis
Factor analysis is a technique to reduce many variables into fewer numbers of factors. Factorial studies focus on different variables and are subdivided into principal component analysis and correspondence analysis.
Example –
Company ABC is planning to understand the factors contributing to user engagement. It collects data from a user population and tracks their activities, such as the number of posts they make, the number of comments they leave, and the number of likes they give on the company’s posts.
Company ABC can use factor analysis to identify the underlying factors that explain the variation in user engagement. The results can help the company understand its areas of improvement, particularly the content that can provide more useful information to its users, thereby boosting engagement.
Related – Top Data Mining Algorithms You Should Learn
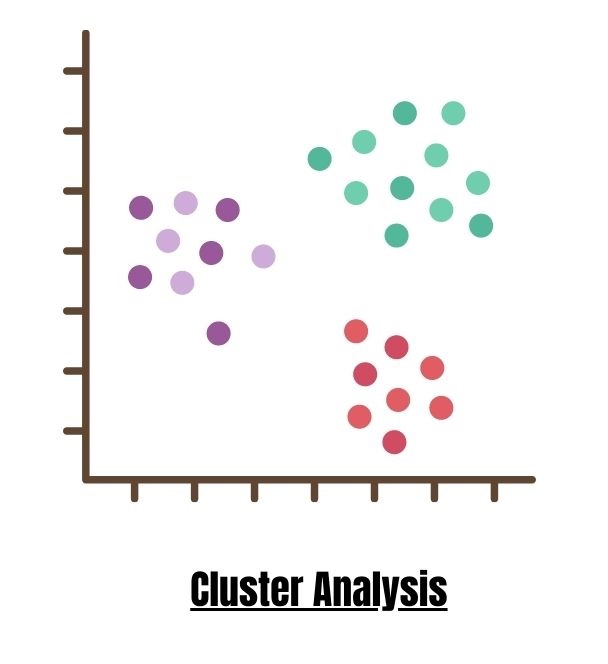
Cluster Analysis
Cluster analysis is a statistical technique to identify groups or “clusters” of similar objects or cases. The cases can be individuals, companies, or products, and the variables used to group them can be qualitative or quantitative. The main objective of cluster analysis is to find patterns or structures in the data that can help better understand the phenomenon being studied.
Example:
Streaming services like Netflix and Amazon Prime collect the following data about their customers:
- Minutes watched per day
- Total viewing sessions per week
- Number of unique shows viewed per month
Clustering algorithms help these streaming platforms group people with similar interests and suggest their interest-specific Sci-Fi movies and shows to users who have previously watched many Sci-Fi movies.
You May Like – An Introduction to Different Methods of Clustering In Machine Learning
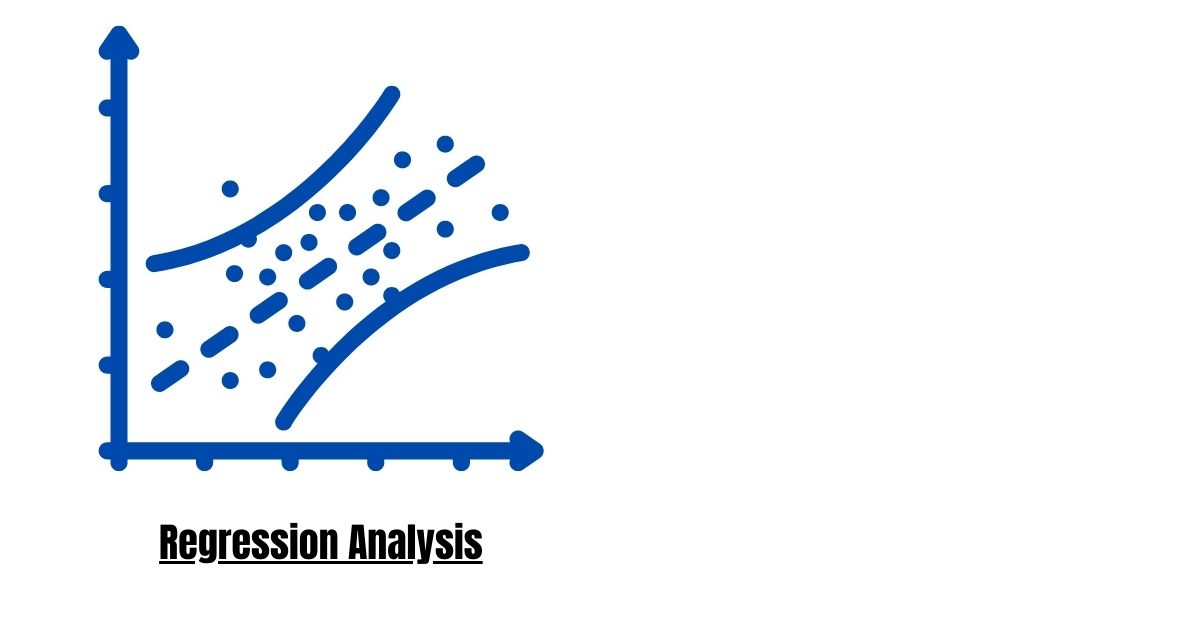
Regression Analysis
Regression analysis is a statistical process that analyzes the relationship between two or more variables, one dependent on the other variables used in mathematical calculation. In other words, a regression analysis makes it possible to understand how independent variables directly affect another variable that depends on them.
Example:
An e-commerce company wants to understand the factors influencing the number of items customers purchase. It collects data from a sample of customers, tracking their shopping behavior, such as the number of items they add to their cart, the number of items they check out, or the items they purchase.
The company uses regression analysis to identify the factors that significantly impact the number of items customers purchase. The regression analysis results may suggest that price, customer reviews, and loyalty significantly impact the number of items customers purchase.
These results can help the company develop more effective marketing campaigns and product offerings. It can focus on offering discounts on high-priced items, partnering with influencers to generate positive product reviews, or developing loyalty programs to reward repeat customers.
Deviance Analysis
Deviance analysis determines the influence of several or individual group variables by calculating statistical averages. Here you can compare variables within one or different groups, depending on the assumption of the deviations.
Example:
A hospital wants to understand the factors contributing to patient readmissions. The hospital collects data from a sample of patients, tracking their medical history, treatments, and readmissions.
The hospital uses deviance analysis to identify the underlying factors that explain the variation in patient readmissions. The deviance analysis results suggest chronic conditions are major factors contributing to patient readmissions.
The deviance analysis results can help the hospital develop more effective interventions to reduce patient readmissions. For example, the hospital can focus on providing better care for patients with chronic conditions.
Discriminant Analysis
Used in the context of deviance analysis to differentiate between groups with similar or identical characteristics.
Example
On the human resources front, discriminant analysis can help predict job success based on predictors like educational background, experience and skill levels, and personality test scores. The dependent variable could be a binary measure of job success or a multi-category measure (low, medium, or high performer).
MANOVA (Multivariate Analysis of Variance)
MANOVA is a statistical test that analyzes the relationship between several response variables and a common set of predictors. It requires continuous response variables and categorical predictors. MANOVA has some important advantages compared to running multiple ANOVA analyses, one response variable at a time.
Example
MANOVA algorithms can help online educational platforms group students based on their learning styles, such as visual, auditory, and kinesthetic learners or identify factors that influence student performance in online courses, such as prior knowledge, self-regulation, and technology skills. This information can help improve online course design and provide more effective support services to students.
Must Read – ANOVA Test in Statistical Analysis – The Introduction
Advantages of Multivariate Analysis
Here are some of the advantages of multivariate analysis:
- Multivariate analysis allows you to look at the relationships between multiple variables, which can give you a more complete understanding of your data.
- Using multivariate analysis, you can make predictions about future events. For example, it can predict customer behavior, the likelihood of a loan default, or the outcome of a sporting event.
- Multivariate analysis can identify patterns in your data. You can understand how your data is distributed and identify trends or anomalies.
- It can be used to understand the relationships between different variables in your data. This can help you to understand how the variables affect each other and to identify any causal relationships.
Conclusion
Multivariate analysis is always used when more than three variables are involved, and the context of its content is unclear. It is a powerful technique to examine the relationship between multiple variables. We hope this blog on types of multivariate techniques was helpful.
FAQs
When should I use multivariate analysis?
Multivariate analysis should be used when you have data with multiple variables and want to identify patterns and relationships between them. It can also be used to make predictions about future data.
What are some of the common mistakes made when using multivariate analysis?
Some of the common mistakes made when using multivariate analysis include: Using the wrong type of multivariate analysis technique for the data; Not having enough data; Not checking for outliers and missing data; Not interpreting the results correctly.
What are the limitations of using multivariate analysis?
Multivariate analysis also has some limitations, including: It can be complex and difficult to understand; It can be sensitive to outliers and missing data; The results of multivariate analysis can be difficult to interpret.
What is the future of multivariate analysis?
The future of multivariate analysis is bright. Multivariate analysis will become more powerful and useful as data collection and analysis techniques improve. Multivariate analysis will solve a wider range of problems, making the results more accessible to a wider audience.
What are some of the challenges facing multivariate analysis?
One of the biggest challenges facing multivariate analysis is the complexity of the techniques. Multivariate analysis can be difficult to understand and interpret, even for experienced statisticians. Another challenge is the availability of data. To use multivariate analysis, you must have a large dataset with multiple variables. This can be a challenge, especially for small businesses and organizations.

Rashmi is a postgraduate in Biotechnology with a flair for research-oriented work and has an experience of over 13 years in content creation and social media handling. She has a diversified writing portfolio and aim... Read Full Bio


