Statistics Interview Questions for Data Scientists
In this article, Statistics Interview Questions for Data Scientists are listed. It starts with defining Statistics and ends with describing Empirical Rule.
Introduction:
Data Science is an interdisciplinary field within the context of Mathematics, Statistics, Computer Science, and Domain knowledge. Statistics questions are the most favorite question for any Data Science Interview ranging from very basics like explaining Measure of Central Tendency and how they are impacted with the skewness or outlier to Define p-value(one of the most favorite questions).
This article comprises the Statistics Interview Questions for Data Scientists.
Best-suited Statistics for Data Science courses for you
Learn Statistics for Data Science with these high-rated online courses
Statistics Interview Questions for Data Scientists
Q1. What is Statistics?
Ans. Statistics is the science concerned with developing and studying methods for collecting and analyzing, interpreting, and presenting empirical data(information that comes from research).
Must Check: Basics of Statistics for Data Science
Q2. What are the types of data?
Ans. Categorical – Describe category or groups
Example – Car Brands( Audi, BMW, TATA)
Numerical – Represent numbers
These are of two types:
- Discrete
Example – Grade, Number of Objects
- Continuous
Example – Weight, Height, Area
Q3. Difference between Population and Sample?
Ans. The Population is a collection of all items of interest while the Sample is the subset of the population. The numbers obtained from the population are called Parameters while the numbers obtained from the sample are called Statistics. Sample data are used to make conclusions on Population data.
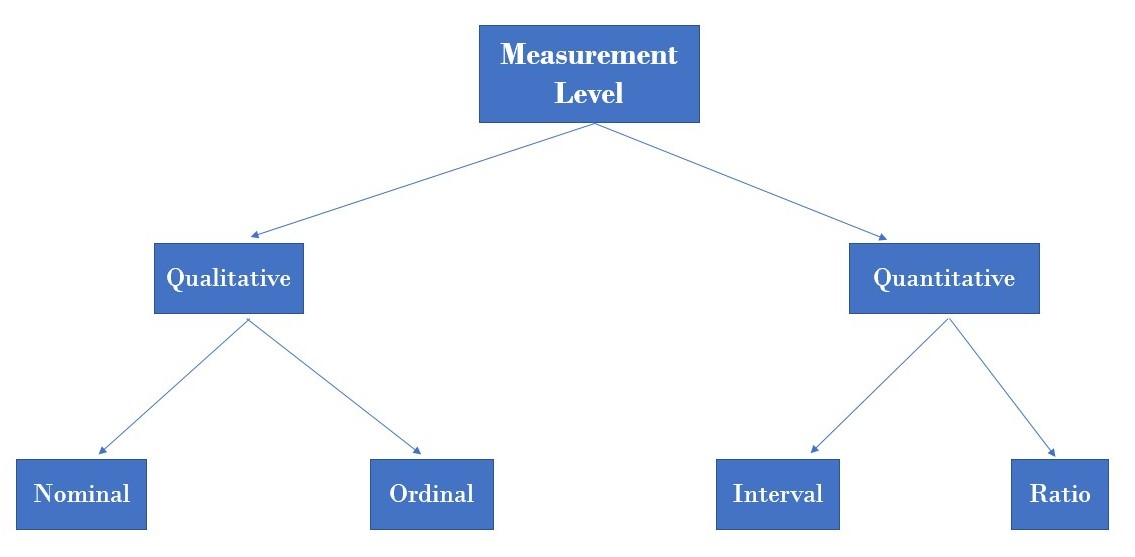
Q4. What are the different types of variables or measurement levels?
Ans.
Q5. Difference between Descriptive and Inferential Statistics?
| Descriptive | Inferential |
| Summarize the characteristics(properties) of the data. | Used to conclude the population. |
| It helps to organize, analyze, and present data in a meaningful way. | It allows comparing data and making predictions through hypotheses. |
| Done using charts, tables, and graphs. | Achieved through probability. |
Must Check: Introduction to Inferential Statistics
Q6. What are the Measures of Central Tendency?
The measure of central tendency is a single value that describes(represents) the central position within the dataset. Three most common measures of central tendency are Mean, Median, and Mode.
Mean:
Mean(Arithmetic Mean) is defined as the sum of all values divided by the number of values. If there are n values given ( x1, x2, x3,……xn ) then,
Median:
Median is the exact middle value when the data is ordered(i.e. arranged either in ascending or descending order ). If there are n values given ( x1, x2, x3,……xn ) then,
Case – I: if n is odd:
Case – II: if n is even:
Mode:
Mode is the most frequent value in the dataset. It may or may not be unique. i.e. in the dataset, more than one value can be the mode.
Must Check: Measure of Central Tendency: Mean, Median and Mode
Q7. Which is the best measure of central tendency – Mean, Median, Mode?
- If the data is symmetrically distributed then
Mean = Median = Mode
- If the distribution is Skewed, then Median is the best measure of central tendency
- Mean is most sensitive for skewed data.
- Mode is the best measure for all levels of measurement, but more meaningful for Qualitative Data
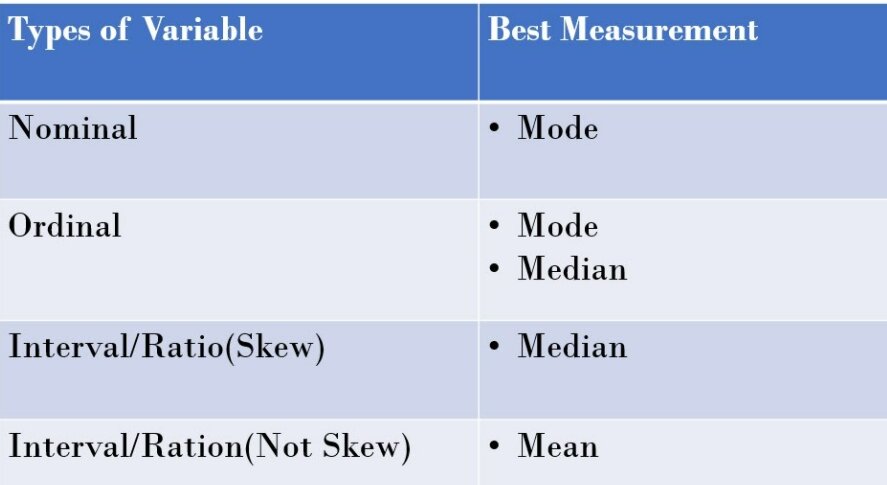
- Variables and the corresponding best measures:
Q8. What are the Measures of Dispersion?
Dispersion or variability describes how items are distributed from each other and the centre of a distribution.
The measure of dispersion is a statistical method that helps to know how the data points are spread in the dataset.
There are 4 methods to measure the dispersion of the data:
- Range
- Interquartile Range
- Variance
- Standard Deviation
Q9. Which measure of dispersion is best?
Standard Deviation is considered the best measure of dispersion as
- Help to make a comparison between the distribution of two or more different datasets
- Based on all values
- Capable of further algebraic treatment
Must Check: Measures of Dispersion: Range, IQR, Variance, Standard Deviation
Q10. What is the Central Limit Theorem?
Then the distribution of the sample means will be approximately normally distributed regardless of whether the population is normal or skewed.
Provided that the sample size is sufficiently large (n > 30).
Must Check: Central Limit Theorem
Q11. What is the difference between Covariance and Correlation?
Covariance
- Signifies the direction of the linear relationship between two variables
- In simple terms, It is a measure of variance between two variables
- It can take any value from positive infinity to negative infinity
Correlation
- It measures the relationship between two variables, as well as the strength between these two variables.
- It can take any value from -1 to 1
Q12. What are the different types of Correlation?
There are mainly three types of correlation:
- Pearson
- Spearman Rank
- Kendall Rank
Must Check: Covariance and Correlation
Q13. What is the difference between Probability and Likelihood?
Probability attaches to possible results (chances) while Likelihood attaches to the hypothesis.
Let’s understand the difference by an example of cricket,
Problem: Captain have to decide to bat first
Probability: Only two possibilities
- Choose to Bat
- Doesn’t choose to Bat
- P(choose to bat) = P(doesn’t choose to bat) = ½ = 0.5
Likelihood: Choosing to bat first will depend on
- Weather Conditions ( Rainfall, wind speed)
- Due on Pitch
- Humidity
Must Check: Introduction to Probability
Q14. What are the different types of Probability Distribution used in Data Science?
A probability distribution is a statistical function that describes all the possible values and likelihoods that a random variable can take within a given range. Probability distribution depends on various factors like maximum, minimum, mean, standard deviation, skewness, and kurtosis.
The six, most common probability distributions are:
- Normal Distribution
- Poisson Distribution
- Binomial Distribution
- Uniform Distribution
- Exponential Distribution
- Bernoulli Distribution
Must Check: Probability Distribution Used in Data Science
Q15. What is Normal Distribution?
Normal Distribution is a probability distribution that is symmetric about the mean. It is also known as Gaussian Distribution. The distribution appears as a Bell-shaped curve which means the mean is the most frequent data in the given data set.
In Normal Distribution:
- Mean = Median = Mode
- Total area under the curve is 1.
- The probability distribution function(PDF) of a random variable x of a Normal Distribution is given by:
Must Check: Normal Distribution: Definition and Examples
Q16. What is the empirical rule?
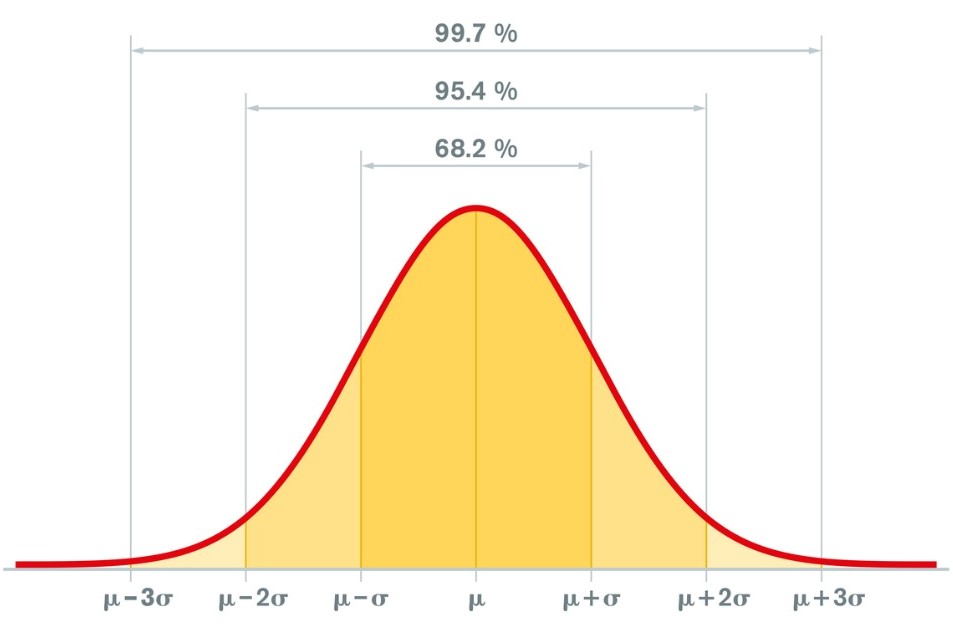
Empirical Rule is often called the 68 – 95 – 99.7 rule or Three Sigma Rule. It states that on a Normal Distribution:
- 68% of the data will be within one Standard Deviation of the Mean
- 95% of the data will be within two Standard Deviations of the Mean
- 99.7 of the data will be within three Standard Deviations of the Mean
Q17. What is Skewness?
It is a measure of lack of symmetry i.e. it measures the deviation of the given distribution of a random variable from a symmetric distribution (like normal Distribution).
There are two types of skewness:
- Positive Skewness
- Negative Skewness
Must Check: What is Skewness
Related Read: Skewness and Kurtosis
Q18. What are the different measures of Skewness?
There are different ways to measure the skewness like
- Pearson Mode
- Pearson Median
- Momental
- Kelly’s Measure
- Bowley
But we mainly use the first two, Pearson mode and Pearson median skewness.
Must Check: Skewness in Statistics – Overview, Concepts, Types, Measurements and Importance
Q19. What is Conditional Probability?
Let there be two events A and B of any random experiment,
then the probability of occurrence of event A, such that event B has already occurred is known as Conditional Probability.
Q20. What is Bayes’ Theorem?
Bayes’ theorem is an extension of Conditional Probability.
It includes two conditional probabilities.
It gives the relation between conditional probability and its reverse form.
Must Check: Introduction to Bayes’ Theorem
Q21. What is Regression Analysis?
It is a statistical method to model the relationship between a dependent (target) variable and independent (one or more) variables.
It gives a clear understanding of factors that are affecting the target variable in building machine learning models.
These models are used to predict the continuous data.
Example: Predicting Rainfall depends on humidity, temperature, direction and speed of the wind.
Q22. What are the different types of Regression?
There are mainly 5 types of regression:
- Linear
- Polynomial
- Logistic
- Ridge
- Lasso
Must Check: Regression Analysis in Machine Learning
Q23. What is Sampling?
It is a process of selecting a group of observations from the population, to study the characteristics of the data to make conclusions about the population.
Example: Covaxin (a covid-19 vaccine) is tested over thousand of males and females before giving it to all the people of the country.
Q24. What is a Sampling Error and how it can be reduced?
Errors which occur during the sampling process are known as Sampling Errors
They can be reduced by:
- Increasing the sample size
- Classifying the population into different groups
Must Read: Mean Square Error
Must Read: Difference Between Standard Error and Standard Deviations
Q25. What is Resampling and what are the common methods of resampling?
Resampling is the method that consists of drawing repeatedly drawing samples from the population.
It involves the selection of randomized cases with replacements from samples.
There are two types of resampling methods:
- K-fold cross-validation
- Bootstrapping
Must Check: Introduction to Sampling and Resampling
Q26. What is an outlier in any dataset?
An outlier is a value in the data set that is extremely distinct from most of the other values.
Example:
Let there are 5 children having weights of 30 kg, 35 kg, 40kg, 50 kg and 300 kg.
Then the student’s weight having 300 kg is an outlier.
An outlier in the data is due to
- Variability in the data
- Experimental Error
- Heavy skewness in data
- Missing values
Also Read: Outlier Detection using SQL
Q27. What are the different methods to detect outliers in a dataset?
There are mainly 3 ways to detect outliers in a dataset:
- Box-Plot
- Inter Quartile Range
- Z-score
In a normal distribution, any data point whose z-score is outside the 3rd standard deviation is an outlier.
Must Check: Outliers: Definition and Examples in Python
Q28. What is Cost Function?
The cost function measures the performance of machine learning models.
It quantifies the error between the actual and predicted value of the observation data.
In linear regression, there are many evaluation metrics (mean absolute error, mean squared error, R squared, RMSLE, RMSE etc) to quantify the error, but we generally use Mean Squared Error:
This Mean squared function is also referred to as Cost Function.
Note: Depending upon the evaluation metrics, cost functions are different.
Must Read: Cost Function in Linear Regression
Q29. What is Gradient Descent?
Gradient Descent is an optimisation algorithm used to find the value of the parameters of a function that minimizes the cost function.
In the gradient descent, we calculate the next point using the gradient of the cost function at the current position.
The process is given by:
Must Check: Gradient Descent in Machine Learning
Q30. What is Hypothesis Testing?
Hypothesis testing is a form of statistical inference that uses data from a sample to draw conclusions about a population parameter or a population probability distribution.
There are 3 steps in Hypothesis Testing:
- State Null and Alternate Hypothesis
- Perform Statistical Test
- Accept or reject the Null Hypothesis
Q31. What is the Null and Alternate Hypothesis?
A null and alternate hypothesis is used in statistical hypothesis testing.
Null Hypothesis
- It states that the population parameter is equal to the assumed value
- It is an initial claim based on previous analysis or experience
Alternate Hypothesis
- It states that population parameters are equal or different to the assumed value
- It is what you might believe to be true or want to prove true
Must Check: Difference Between Null Hypothesis and Alternate Hypothesis
Q32. What are a p-value and its role in Hypothesis Testing?
P-value is the probability that a random chance generated the data or something else that is equal or rare.
P-values are used in hypothesis testing to decide whether to reject the null hypothesis or not.
- p-value < alpha – value
Means results are not in favor of the null hypothesis, reject the null hypothesis
- p-value > alpha – value
Means results are in favor of the null hypothesis, accept the null hypothesis.
Must Check: P-value
Q33. What Chi-square test?
A statistical method is used to find the difference or correlation between the observed and expected categorical variables in the dataset.
Example: A food delivery company wants to find the relationship between gender, location and food choices of people in India.
It is used to determine whether the difference between 2 categorical variables is:
- Due to chance or
- Due to relationship
Must Check: Chi-square test: Definition and Example
Q34. What is a t-test?
Statistical method for the comparison of the mean of the two groups of the normally distributed sample(s).
It is used when:
- Population parameter (mean and standard deviation) is not known
- Sample size (number of observations) < 30
Must Check: t-test : Definition and Example
Q35. What is the ANOVA test?
Analysis of Variance (ANOVA) is a statistical formula used to compare variances across the means (or average) of different groups. A range of scenarios uses it to determine if there is any difference between the means of different groups.
Must Check: ANOVA test
Conclusion:
In this article, we tried to answer statistics questions asked during the Data Science interview in a most simplified way. Hope you will enjoy the article and will enhance your statistical concepts.
Related Reads:


FAQs
What is the difference between standard deviation and variance?
Variance and standard deviation are both measures of the spread or variability of a dataset. The variance is the average of the squared differences of each data point from the mean. The standard deviation is the square root of the variance. The main difference is that variance is measured in squared units of the original data, while standard deviation is measured in the same units as the data itself. Standard deviation is easier to interpret because it is expressed in the same units as the data.
What is a p-value? How is it used in hypothesis testing?
The p-value is the probability of observing a test statistic as extreme or more extreme than the one observed, assuming the null hypothesis is true. In hypothesis testing, the null hypothesis is typically a statement that there is no difference between two groups or that a particular value is true. If the p-value is less than a pre-determined significance level, usually 0.05, the null hypothesis is rejected in favor of the alternative hypothesis. This means that the observed difference is statistically significant.
Explain the difference between Type I and Type II errors in hypothesis testing.
In hypothesis testing, a Type I error occurs when the null hypothesis is rejected even though it is actually true. This is also known as a false positive. Type II error, on the other hand, occurs when the null hypothesis is not rejected even though it is false. This is also known as a false negative. The probability of making a Type I error is denoted by alpha and is usually set at 0.05. The probability of making a Type II error is denoted by beta and is typically set at 0.20.
What is the central limit theorem and why is it important?
The central limit theorem states that as the sample size increases, the distribution of the sample means will approach a normal distribution, regardless of the shape of the population distribution. This is important because it allows us to make inferences about a population based on a sample. For example, if we have a large enough sample size, we can use the mean of the sample to estimate the mean of the population.
What is Mean Squared Error?
Mean squared error (MSE) is defined as the mean or average of the squared differences between the actual and estimated values. Mean Squared Error (MSE) measures the amount of error in a statistical model.
Difference between Population and Sample?
The Population is a collection of all items of interest while the Sample is the subset of the population. The numbers obtained from the population are called Parameters while the numbers obtained from the sample are called Statistics. Sample data are used to make conclusions on Population data.
What is the difference between Covariance and Correlation?
Covariance Signifies the direction of the linear relationship between two variables In simple terms, It is a measure of variance between two variables It can take any value from positive infinity to negative infinity Correlation It measures the relationship between two variables, as well as the strength between these two variables. It can take any value from -1 to 1

Vikram has a Postgraduate degree in Applied Mathematics, with a keen interest in Data Science and Machine Learning. He has experience of 2+ years in content creation in Mathematics, Statistics, Data Science, and Mac... Read Full Bio


