How to Create a Forecast in Tableau
In this article, we will discuss what is forecasting, how does forecasting works in tableau, data requirement and constraints and finally how to create forecasting in tableau.
Table of Content
Best-suited Tableau courses for you
Learn Tableau with these high-rated online courses
What is Forecasting?
With every next second, data is increasing in GigaBytes(GB) or TeraBytes(TB), and every sector (manufacturing, information & technology, trade, health, real estate, etc.) is using these data to improve their services. This collected data help in the determination of the direction of future trends.
This is what Forecasting means.
Forecasting is the process of pre-predicting what will happen in the future based on the past evidence. It acts as a strategic management process to align the business’s goals.
In one line, Forecasting is about predicting what will happen in the future.
Note: Forecasting is concerned with a specific problem or set of facts.
Must Check: What is Tableau?
Must Check: Tableau Online Courses & Certifications
Let’s move forward with a simple question.
Example: In Sample Super-Store data,
How will you increase the profit without increasing discounts?
How does Forecasting work in Tableau?
There are many mathematical models used to forecast. In Tableau, a technique name Exponential Smoothing is used for Forecasting. It tries to find a regular pattern in measures that can be continued into the future.
When there is not enough data in the visualization, Tableau automatically forecasts at a finer temporal granularity and then aggregates the forecast back to the granularity of the visualization.
Tableau automatically selects the best of up to eight models, the best being the one that generates the highest quality forecast.
Note: More the data you have, the better is the prediction model.
Exponential Smoothing:
It is an iteratively predicts the future value of a regular time series of values from the weighted averages of past values of the series.
The method is called exponential because every preceding actual value influences the values of each level to an exponentially decreasing degree (more recent values are given greater weight)
An exponential smoothing model with the trends and seasonal components is effective when the forecasted measure shows trends or seasonality over the time interval.
- Trend: Tendency in the data to increase or decrease over time.
- Seasonality: It is a repeating, predictable variation in the value.
Model Type
Tableau automatically suggests the required appropriate model for forecasting the data. But you can also choose Custom in the Forecast Model dialog box to independently specify trends and season characteristics.
In trends, Tableau has three options in the drop-down:
- None
- Additive
- The contribution of model component are summed
- Multiplicative
- At least some components are multiplied
- Improve forecast quality for data having trends and seasonality is affected by the magnitude of the data
- It can’t be used when the measure to be forecast has at least one value less than or equal to zero.


Data requirements and Constraints
Data Requirement
- At least one date dimension and one measure
- Tableau performs Forecasting if the date dimension is not available
- In the absence of a time-series dimension, it will check the availability of dimension with an integer value in the view
- Tableau performs Forecasting if the date dimension is not available
Constraints
- No forecast can be added when the view contains:
- Table calculation
- Disaggregated values
- % calculations
- Subtotal
- Grand Total
- Date value with aggregation set to the exact date
Create a Forecast
In Tableau, creating a forecast is a straightforward task; you don’t have to think much about it, what should be the parameters, models, etc. Tableau automatically does this for you. But you also change them using Custom.
Let’s understand how to create a forecast using an example.
Problem Statement: Predict the sale using the sample superstore data.
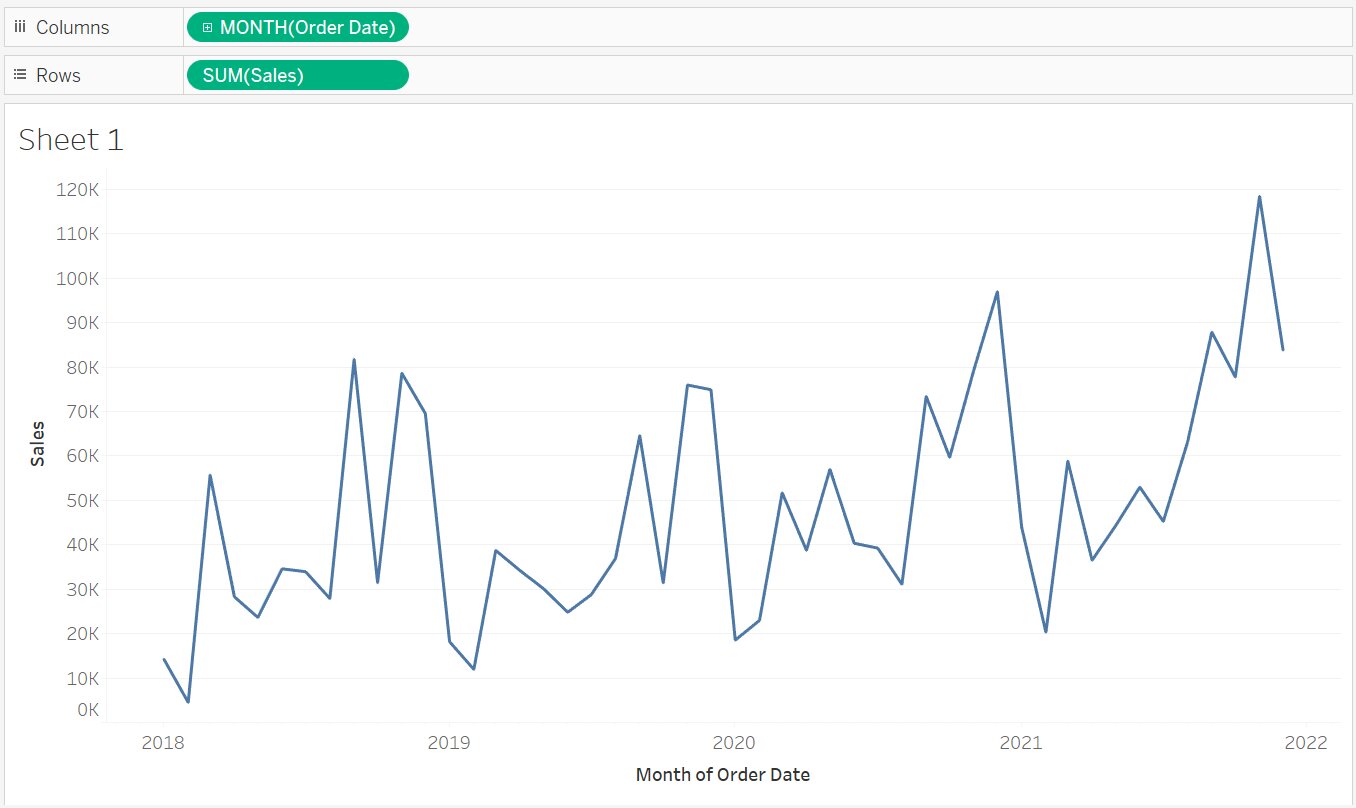
- Drag and Drop Order Order Date(Change Year to Month) into the column shelf
- Drag and Drop Sales into the row shelf
Now, in Tableau we have two methods to create a forecast:
Method 1: From the View
- Right-click on visualization -> Forecast -> Show Forecast
Method 2: Using Toolbar
- Analysis -> Forecast -> Show Forecast
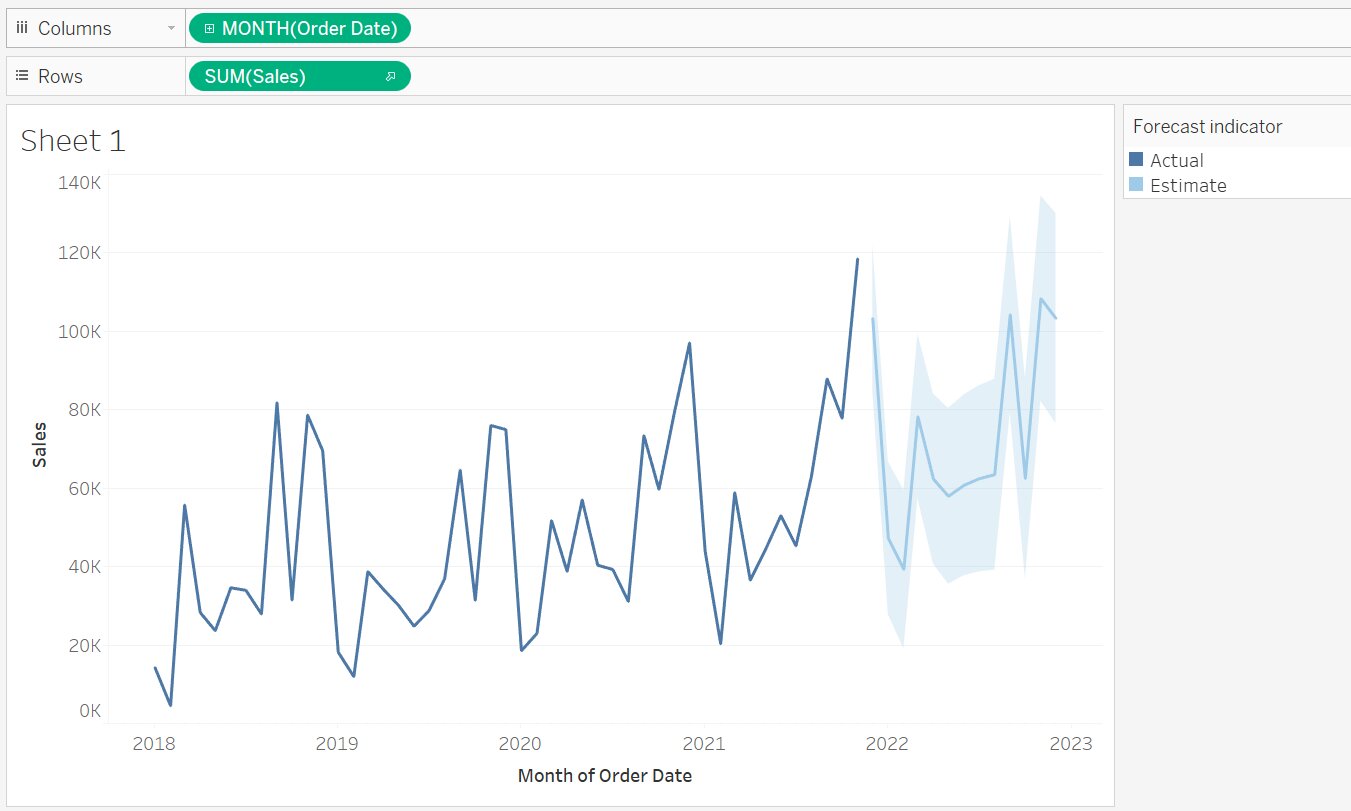
When you use either of the two methods, you will get the result:
Tableau, visualize estimated future value of the measure with the past data. The estimated future value are shown in lighter shade (by default) of color used for the past data.


In this article, we will discuss one of the important concepts...read more
Conclusion
In this article, we have discussed about what is forecasting, how does forecasting works in tableau, data requirement and constraints and finally how to create forecasting in tableau.
Hope this article will help you in Data analysis journey.
Top Trending Articles:
Data Analyst Interview Questions | Data Science Interview Questions | Machine Learning Applications | Big Data vs Machine Learning | Data Scientist vs Data Analyst | How to Become a Data Analyst | Data Science vs. Big Data vs. Data Analytics | What is Data Science | What is a Data Scientist | What is Data Analyst


