What is Polynomial Regression in Machine Learning?
You will learn advantages,disadvantages and application of Polynomial Regression.You will also see the implementation of polynomial regression.
Learn the importance of polynomial regression in machine learning (ML) operations to find the value of independent variables.
The connection between two sets of events, or, mathematically speaking, variables—between a dependent variable and one or more independent variables—can be studied using regression analysis, a useful statistical technique. For instance, the number of hours (independent variable) you spend working out at the gym determines how much weight (dependent variable) you lose.
When no linear connection can be found between all the variables, polynomial regression is required. So, it appears to be a nonlinear function rather than a line. Let’s examine this kind of regression in more detail.
Best-suited Machine Learning courses for you
Learn Machine Learning with these high-rated online courses
What is Polynomial Regression?
Polynomial regression treats the link between independent variable x and dependent variable y as an nth-degree polynomial. A nonlinear connection between the value of x and the associated dependent mean of y, denoted E (y | x), can be estimated via this model.
Below is the equation:
y= b0+b1x1+ b2x12+ b2x13+…… bnx1n
Since we turn the equation for multiple linear regression into a polynomial regression equation by inserting extra polynomial parts. We can also refer to machine learning as a subcategory of multiple linear regression. Another name for this is Multiple Linear Regression Special Case in Machine Learning. You can also, transform the equation for multiple linear regression into polynomial regression, and add specific polynomial terms.
One of the crucial components of machine learning is polynomial regression. We use an nth-degree polynomial as the basis for the relationship between the independent variable (x) and the dependent variable (y) in the regression procedure known as polynomial regression. Generally, it produces the most accurate estimation for both dependent and independent variables. Therefore, we must include some polynomial terms to transform the multiple linear regression into a polynomial regression.
It is a linear model that has been modified in a few ways to improve accuracy. Hence, the trained model for this is nonlinear in character. Also, the complex and nonlinear functions fit using a linear regression approach.
It is a lifesaver when dealing with a dataset that is not linearly separable. Due to the nonlinear nature of the dataset utilized for this method training. when it is difficult for the linear regression model to derive any relationship between reliable and unreliable variables.
Making the required adjustments to a linear regression model will transform it into a polynomial regression model. Hence, making the linear regression model capable of handling challenging nonlinear functions and datasets is one of the key motivations behind this development.


Importance of Polynomial Regression in ML
A few criteria that specify the requirement are below. Let’s understand.
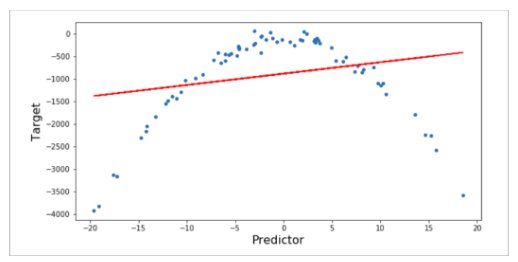
- Deploying a linear model to a linear database gives us an excellent result. However, if we apply the same unchanged model to a nonlinear dataset, the results would be drastically different. The loss of function will grow, leading to a high mistake rate and declining accuracy. These result in increased mistake rates, a drop in accuracy, and increased loss of function.
- We require it in situations with non-linear data points.
- A linear model will only cover data points if a nonlinear model is available and you attempt to cover it. A polynomial model is employed to guarantee that all data points are included.
We thus require this model for such situations when the data points are organized non-linearly.
Implementing Polynomial Regression through Python
Regression analysis’ main objective is to describe the relationship between the significance of an independent variable, x, and the predicted value of a dependent variable, y.
Use this method effectively in machine learning by following the procedures listed below.
Step 1: The libraries and datasets used to execute must be imported at this stage.
# Importing the librariesimport numpy as npimport matplotlib.pyplot as pltimport pandas as pd
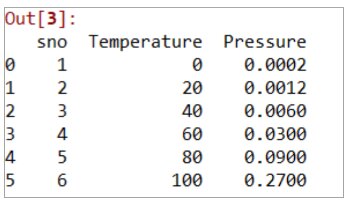
# Importing the datasetdatas = pd.read_csv('data.csv')datas
Result:
Step 2: The dataset must be split into two parts, x and y. The columns in Y will be the two columns, while the columns in X will be 1 and 2.
x = datas.iloc[:, 1:2].valuesy = datas.iloc[:, 2].values
Step 3: Building of linear regression model has two aspects
# Fitting Linear Regression to the datasetfrom sklearn.linear_model import LinearRegressionlin = LinearRegression()lin.fit(X, y)
Step 4: x and y two parts of this model that must be fitted.
# Fitting Polynomial Regression to the datasetfrom sklearn.preprocessing import PolynomialFeatures poly = PolynomialFeatures(degree = 4)X_poly = poly.fit_transform(X) poly.fit(X_poly, y)lin2 = LinearRegression()lin2.fit(X_poly, y)
Step 5: A graphical representation of linear regression can show the results.
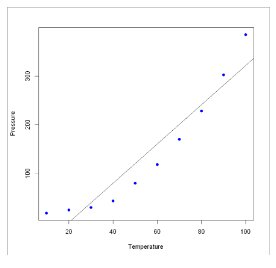
# Visualising the Linear Regression resultsplt.scatter(X, y, color = 'blue') plt.plot(X, lin.predict(X), color = 'black')plt.title('Linear Regression')plt.xlabel('Temperature')plt.ylabel('Pressure')plt.show()
Result: –
Step 6: In this phase, a line graph will also be used to visualize this method
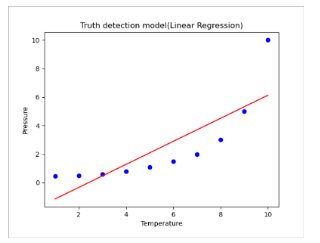
# Visualising the Polynomial Regression resultsplt.scatter(X, y, color = 'blue') plt.plot(X, lin2.predict(poly.fit_transform(X)), color = 'red')plt.title('Polynomial Regression')plt.xlabel('Temperature')plt.ylabel('Pressure') plt.show()
Result:
Step 7: We will use linear and polynomial regression to forecast new findings.
# Predicting a new result with Linear Regression after converting predict variable to 2D arraypred = 110.0predarray = np.array([[pred]])lin.predict(predarray)
Result:
# Predicting a new result with Polynomial Regression after converting predict variable to 2D arraypred2 = 110.0pred2array = np.array([[pred2]])lin2.predict(poly.fit_transform(pred2array))
Result:


Pros of Polynomial Regression
- This method may be easily fit to curves with various radii.
- It is easily applicable to a wide variety of tasks.
- The best approximation of the connection between the two dependent and independent variables is provided by this method.
Cons of Polynomial Regression
- The findings of the nonlinear analysis may suffer if there are one or more outliers in the data.
- Nonlinear regression has fewer model validation techniques available than linear regression. Hence, making it difficult to identify outliers.
Application of Polynomial Regression in Machine Learning
1. Predicting the Rate of Tissue Growth
Different situations call for the application of tissue growth rate estimation. First off, we frequently employ this method to track oncology patients’ tumor growth. Hence, regression of this kind aids in creating a model that considers the nonlinear nature of this spreading.
Furthermore, we can also use tissue growth rate estimation to track ontogenetic growth. It also allows medical professionals to keep an eye on an organism’s growth in the womb from an incredibly early stage.
2. Estimated Death Toll
In order to effectively allocate resources, catastrophe management teams must know how many people will be hurt or killed during disasters such as epidemics, fires, and tsunamis. The team must be ready because it can take days or even months to lessen the effects of such catastrophes.
By examining numerous dependent variables, it enables us to create adaptable machine-learning models that report the probable death rate. These variables may include, for instance, the patient’s history of chronic illnesses, how frequently they expose to big crowds of people, and their access to protective gear in COVID-19 outbreaks.
3. Software that Controls the Speed
Modern speed regulation software companies powered by ML increasingly focus on preventing risky behaviour rather than punishing offenders. By using this method in predictive modelling, you may look for trends in driving behaviour and warn them about the need to follow the law even before they go above the posted speed limit. Also, according to reports, preventative methods are more successful at reducing road-ways accidents.
Final Thought
It is a straightforward yet practical approach to predictive analytics. Therefore, it lets you consider non-linear relationships between variables and get accurate results.
You may also use this kind of regression to determine fair remuneration, make illness transmission rate predictions. Moreover, you can also, put preemptive road safety regulatory software in place.
Although not very challenging, this method is not particularly simple either. Therefore, to fully comprehend the concept and determine the outcome, you must pay close attention to the steps and every particular one.
Contributed by-Fukran Khan
FAQs
What is Polynomial Regression in Machine Learning?
Polynomial regression is a form of regression analysis in which the relationship between the independent variable x and the dependent variable y is modeled as an nth degree polynomial. Unlike linear regression, polynomial regression can fit non-linear relationships between variables.
When should you use Polynomial Regression?
Use polynomial regression when your data points clearly show that the relationship between the independent and dependent variables is non-linear, meaning a straight line cannot accurately predict the outcomes. It's particularly useful in cases where the data shows a curvilinear pattern.
How does Polynomial Regression differ from Multiple Linear Regression?
While both are used to predict a dependent variable based on independent variables, polynomial regression fits a non-linear relationship (curved line) to the data. In contrast, multiple linear regression fits a straight line, even if there are multiple independent variables.
What are the risks of using Polynomial Regression?
The primary risk is overfitting, where the model becomes too complex and starts to capture noise in the data, leading to poor performance on new, unseen data. Choosing the right degree for the polynomial is crucial to avoid this.
How do you choose the right degree for a polynomial regression model?
The degree of the polynomial regression model should be chosen based on the dataset's complexity and the curve pattern observed in the data. Cross-validation can be used to compare models with different degrees and select the one with the best performance metrics.
This is a collection of insightful articles from domain experts in the fields of Cloud Computing, DevOps, AWS, Data Science, Machine Learning, AI, and Natural Language Processing. The range of topics caters to upski... Read Full Bio


