- What is a Tree Diagram?
- Weightage of Tree Diagram
- Illustrated Examples on Tree Diagram
- FAQs on Tree Diagram
What is a Tree Diagram?
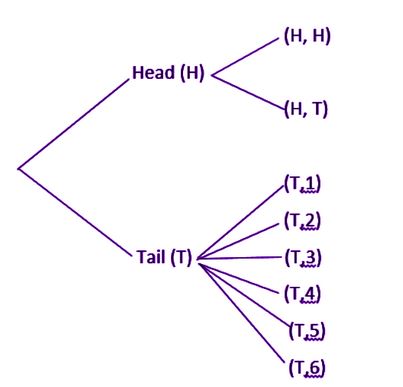
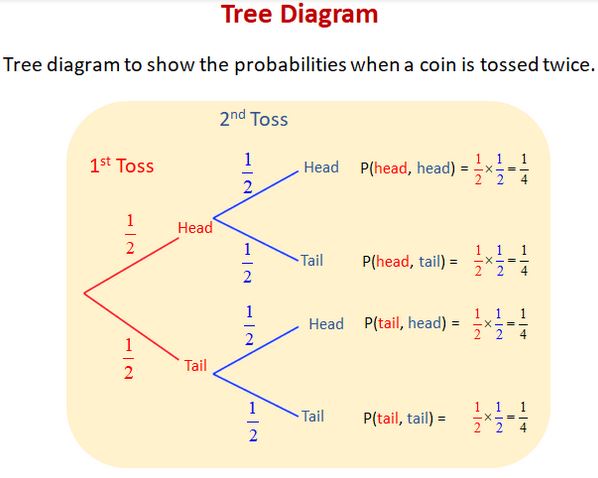
A tree diagram is defined as a visual presentation of a hierarchy in a tree-like diagram in probability theory. A tree diagram is often used to show family relations, classifications, and even so on. However, the tree diagram consists of three features, i.e., node, leaf node, and root node are as follows:
Root Node: A root node is that part that itself a parent node and has no superior parent.
Node: Root Nodes connect the nodes, which both are linked together using line connections, which are known as branches or links. However, it shows the relationship between the members.
Leaf Node: Leaf Nodes are those nodes that do not have any child node and also well-known as end nodes.
Calculation of Overall Probability Using Tree Diagram
Generally, Probability is defined as the likelihood of occurrence of the events. The value of Probability is in numerical form and lies between 0 and 1.
Steps to Calculate Overall Probability
- Written down the values of Probability on the branches.
- After that, multiply the value of Probability and the branches.
- Lastly, make the addition of the obtained probability value after the process of multiplication.
Well, after adding the probability values, your outcome should be 1.
Weightage of Tree Diagram
Tree Diagram is a topic of the chapter named Probability. The chapter consumes a total of 8 to 11 marks of weightage in Class X. Each year, you will find 3 or 4 questions in the examination from the chapter Probability. A tree diagram is a part of class 9th, 10th, 11th, or 12th through the chapter of Probability. Apart from the tree diagram, you will get a few other topics in this chapter, such as:
- Uncertainty
- Statistical Dispersion
- Random sequence, and many more.
Illustrated Examples on Tree Diagram
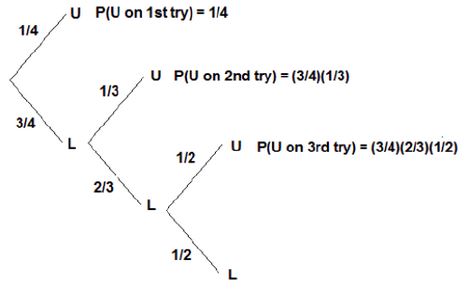
1. An individual has 4 keys, and only 1 key fits the door lock. What is the Probability that the locked door can be unlocked in three tries?
Solution. The Probability (P) of door getting unlocked door in the first attempt = 1/4
The Probability (P) of door getting unlocked door in the second attempt = (3/4)(1/3) = 1/4
The Probability (P) of door getting unlocked door in the third attempt = (3/4)(2/3)(1/2) = 1/4
Therefore, the Probability (P) of door getting unlocked door in the three attempts
= 1/4 + 1/4 + 1/4 = 3/4.
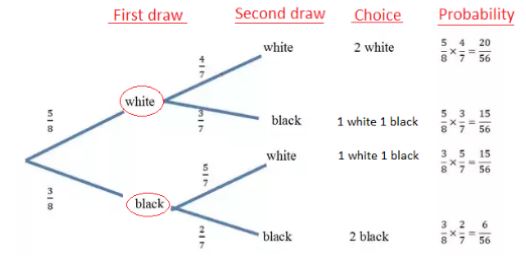
2.A bag consists of 3 black and 5 white pens. Draw the Probability with a tree diagram for two draws.
Solution. Number of Black pens = 3
Number of White pens = 2
Total number of pens = 8
So, the Probability of black balls = 3/8
Probability of white balls = 5/8
Hence, the diagram for two draws of pens with possible outcomes is as follows:
3.One card is picked from a pack of 52 playing cards, without replacement, and then another one is picked. Calculate the Probability of two red cards using a probability tree.
Solution. The Probability of picking two red cards = 25/102.
FAQs on Tree Diagram
Q: What is a Tree Diagram?
Q: Tree Diagram belongs to which chapter?
Q: What is the basic formula to find Probability?
Q: What are the applications of Probability in the real era?
Q: If P (A) = 7/13, P (B) = 9/13, and P (AΩB), Evaluate P (A/B).
Maths Probability Exam
Student Forum
Popular Courses After 12th
Exams accepted
CA FoundationExams accepted
ICSI ExamExams accepted
BHU UET | GLAET | GD Goenka TestBachelor of Business Administration & Bachelor of Law
Exams accepted
CLAT | LSAT India | AIBEExams accepted
IPMAT | NMIMS - NPAT | SET
Exams accepted
BHU UET | KUK Entrance Exam | JMI Entrance ExamBachelor of Design in Animation (BDes)
Exams accepted
UCEED | NIFT Entrance Exam | NID Entrance ExamBA LLB (Bachelor of Arts + Bachelor of Laws)
Exams accepted
CLAT | AILET | LSAT IndiaBachelor of Journalism & Mass Communication (BJMC)
Exams accepted
LUACMAT | SRMHCAT | GD Goenka Test


