CUET Results 2023: UGC Chairman explains CUET Normalisation; Check Details
This year over 22,000 students are in the 100 percentile creating tough competition for college and university admissions. Universities like Delhi University, BHU, Jamia, and AMU will admit students based on CUET Results.

The National Testing Agency announced the results of the Common University Entrance Test for Undergraduate Courses (CUET-UG) on July 15. This year CUET-UG exam was attended by more than 11 lakh students, 513,978 women and 602,028 men. held over multiple sessions between May 21 and July 5.
As many as 249 universities, which include all the central universities, state universities and some private universities will hold their admissions on the basis of CUET-UG performance of students. This year there is an increase in students scoring in the 100 percentile compared to CUET Results last year. 22,836 students are in the topmost performance band, suggesting tougher competition for college admissions.
Now admission season is picking up and students and parents have some confusion related to the normalization score. Below we try to explain the CUET score normalisation process as stated by UGC Chairman himself.
What is CUET Normalisation?
The University Grants Commission Chairman, Prof M Jagadesh Kumar explained how normalization of marks will be carried out for CUET-UG held in multiple sessions in the same subject. Prof Kumar said: “As we know, CUET-UG has been conducted in 27 different subjects with the freedom to the candidates to choose a combination of these subjects. The CUET-UG scores are to be used by several universities across the country for admission to UG programmes.”
He said that it is important to note that CUET-UG has been conducted over a period of six weeks with tests in a given subject held on different days. So naturally the question that arises is how are we going to compare the performance of different students on a common scale since they have written the test in the same subject but on different days.
“We need to ensure that the admissions are made based on a score that accurately compares the performance of the students,” He added.
Unlike CUET-UG, other entrance examinations are limited to fewer subjects. In single-session entrance tests, one common statistically established method is to transform the raw marks into a common uniform scale using the percentile method so that the performance of students can be compared to each other.
But in entrance tests such as CUET-UG, since the test is conducted on different days and in multiple sessions for the same subject, it will give rise to multiple percentiles for each group of students.
Weightage for Sports or Fine Arts- Equipercentile method
In addition to the above difficulty another problem with using only percentiles is that in subjects such as Sports or Fine Arts, some weightage (e.g. 25%) is given to the skill component by some universities. But, the addition of raw marks in the skill component and the remaining weightage (75%) of percentile cannot be done to prepare the rank list because it would be similar to adding oranges to apples.
Prof Kumar has suggested that a solution to this situation is the use of a method called the equi-percentile method. In this method, the percentile for each candidate is calculated using the raw marks of the candidate as compared to the raw marks of others in the same session.
This is done for every session across multiple days for the same subject. These percentiles are then equated and converted into normalised marks. Sessions with a smaller number of candidates are clubbed with bigger sessions.
“In the equi-percentile method, we use the same scale for all candidates independent of in which session they have appeared in a given subject making their performance comparable across sessions. These normalized marks of the candidates, obtained using the equi-percentile method, in different sessions in a given subject can be used in the same way we use the raw marks of a conventional single session examination,” said Prof Kumar.
Therefore, in a particular university, if the raw marks of the skill component have a certain weightage (e.g. 25%), it can be added to the remaining weightage (e.g. 75%) of the normalized marks to prepare the rank list. What is important to note here is that for each subject for which the examination is held in multiple shifts, raw marks are converted into normalised marks on a common scale.
Calculating normalized marks
Let us now see how these normalized marks are calculated on a common scale using the equi-percentile method in a given subject. This involves four steps.
Step 1: Using raw marks of the students in different shifts, calculate the percentiles of students in each shift.
To calculate the normalized marks across different sessions in a given subject, first, we need to find the percentile of each group of these students for each shift using the raw marks they have scored.
Prof Kumar explaining the process said that let us say in a given shift, 100 students have appeared for the test. We sort their marks in decreasing order. Let us assume that one student among these 100 students has scored 87 % marks. Now let us assume that 80 out of 100 students have secured less than or equal to 87% marks. The percentile of this student with 87% marks would be 80/100=0⋅8. The percentile so calculated will always be between 0 and 1 and it is usually rounded off to the requisite number of decimal places.
Step 2: Arrange these percentiles in descending order by noting the raw marks of the students in each shift.
Let us now assume that there are six students (Stu1,Stu2,Stu3,Stu4,Stu5,Stu6). Three of them (Stu2,Stu4,Stu6) have taken the test in shift-1 and the remaining (Stu1,Stu3,Stu5) in shift-2 but all in the same subject. Using the raw marks of these students, first, the percentiles (PStu1 ,PStu2 ,PStu3 ,PStu4 ,PStu5 ,PStu6)of these six students in a given subject are calculated and are sorted in decreasing order. Their Raw Marks (RMStu1, RMStu2, RMStu3, RMStu4, RMStu5, RMStu6)in the test in each shift are also noted corresponding to their percentiles.
Let us assume that the percentiles in descending order are as follows:
PStu5 >PStu2 >PStu1 >PStu4 >PStu6 >PStu3

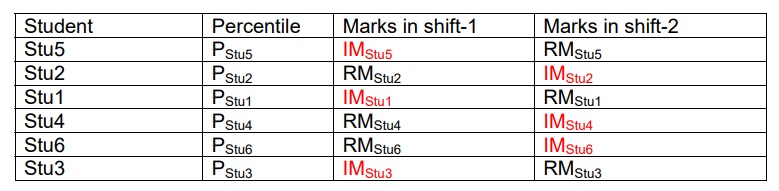
Step 3: Using linear interpolation, calculate the marks of the students in the above blanks in the table
Since some students (Stu2,Stu4,Stu6) have attended shift-1 and not shift-2, their raw marks in the shift-2will not be present. Similarly, the students (Stu1,Stu3,Stu5) who wrote the exam in shift-2, will have no marks in shift-1. These missing marks of each candidate in each shift are then calculated using a method called interpolation.
Interpolation is a mathematical way of estimating missing marks of the students who are absent in one shift because they have already taken the test in the other shift. The Interpolated Marks (IMStu1, IMStu2, IMStu3, IMStu4, IMStu5, IMStu6)of the students are now shown in the table below.
Student Percentile Marks in shift-1 Marks in shift-2
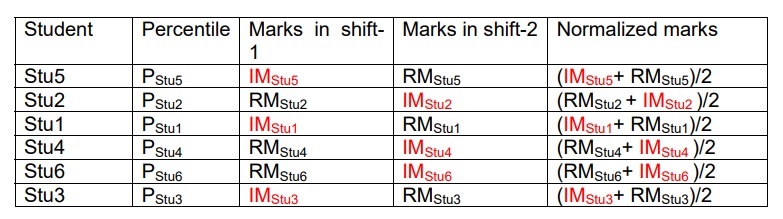
Step 4: Calculate the normalized marks for each student on a common scale.
Using the above method, each percentile value of the candidates sorted in descending order will have marks for both shifts, raw marks and interpolated marks.
Raw marks are available in the shift where the student has written a test and interpolated marks are estimated in the other shift because the student could not have written a test for a second time in the same subject. For each student, we then calculate the average of the actual raw marks in one shift and the marks obtained using interpolation in the other shift. This will give the normalized marks for the corresponding percentile of each candidate as shown below.
Student Percentile Marks in Shift 1 Marks in shift-2 Normalized marks
This method has been shown to be accurate for estimating the normalized marks of candidates when the tests are held in multiple sessions with varying difficulty levels in a given subject.
The scorecard of a candidate will have percentiles and normalised marks. Universities need to use the normalized marks given in the scorecard for preparing the ranking list for admissions.
Follow Shiksha.com for latest education news in detail on Exam Results, Dates, Admit Cards, & Schedules, Colleges & Universities news related to Admissions & Courses, Board exams, Scholarships, Careers, Education Events, New education policies & Regulations.
To get in touch with Shiksha news team, please write to us at news@shiksha.com

Abhay an alumnus of IIMC and Delhi University, has over a decade long experience of reporting on various beats of journalism. During his free time he prefers listening to music or play indoor and outdoor games.
Related News
Latest News
Next Story