- What is Statistics?
- Weightage of Statistics
- Illustrative Examples on Statistics
- Solution.
- Solution.
- FAQs on Statistics
What is Statistics?
Statistics is nothing else but a study or analysis of a group of data to determine or interpret various things. In other ways, statistics can also be defined as classified stats representing people’s condition or state. Three steps solve all the mathematical questions that are asked in statistics. First is the data collection, then comes data summarization, and the last step includes statistical analysis.
Types of Statistics
There are basically two types of statistics which are as followed.
- Descriptive Statistics: In this type of statistics, the data is summarised from the samples; using indexes.
- Inferential Statistics: In this, the results are derived from variations of data subjected to various random variations.
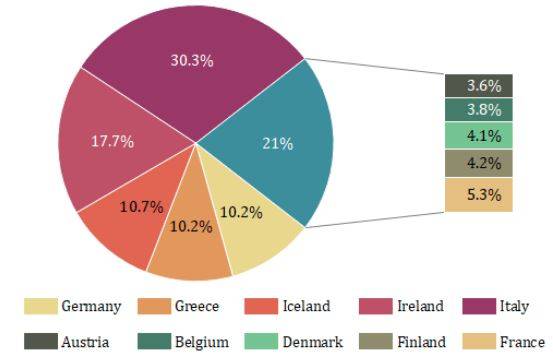
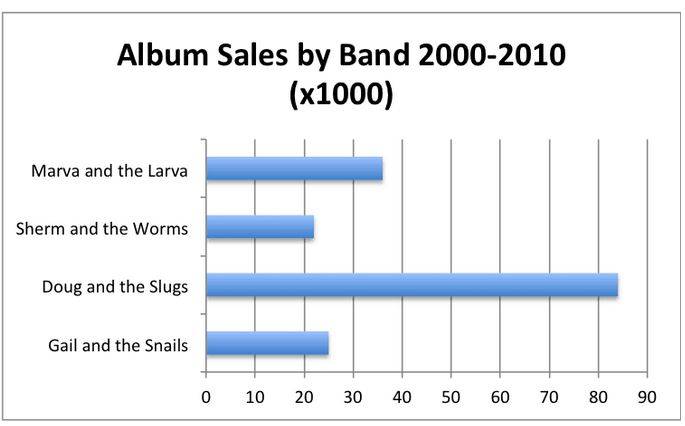
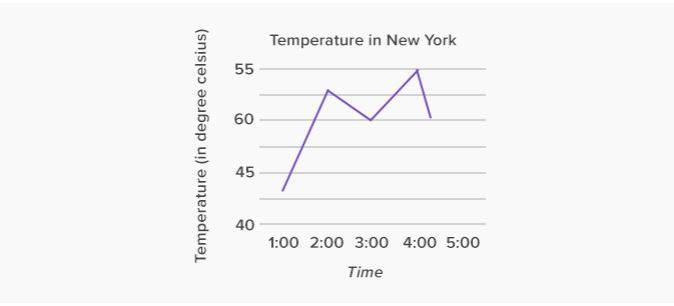
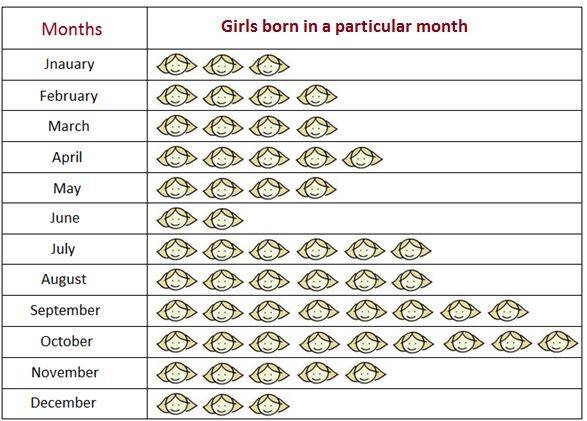
Though you can represent any collected data in various forms, you will be taught 6 different ways to represent it in this chapter. These ways include:
Pie Chart
Bar Graph
Line Graph
Pictograph
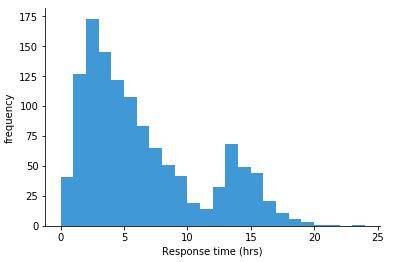
Histogram
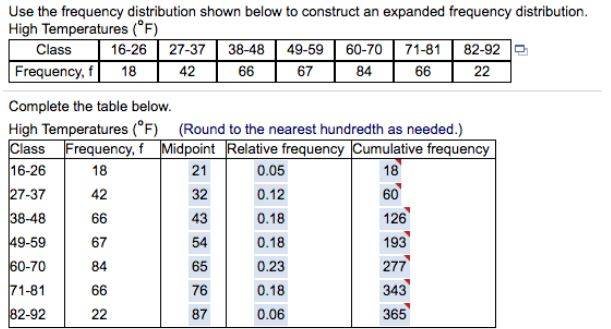
Frequency Distribution
In this chapter, you will also be taught how to calculate mean using various methods. Listed below are the three ways by which you can calculate the mean.
Weightage of Statistics
This chapter holds a lot of importance and weightage in each of the above-given exams. In the 10th board exams, it can be anywhere between 8-10 marks.
Illustrative Examples on Statistics
1. According to a survey, the following data regarding the number of plants in 20 houses in a locality was calculated. What will be the mean number of plants in every house?
Number of Plants 0-2 2-4 4-6 6-8 8-10 10-12 12-14
Number of Houses 1 2 1 5 6 2 3
Solution.
Midpoint (xi) = (upper limit + lower limit)/2
| No. of plants (Class interval) |
No. of houses Frequency (fi) |
Mid-point (xi) |
fixi |
|---|---|---|---|
| 0-2 |
1 |
1 |
1 |
| 2-4 |
2 |
3 |
6 |
| 4-6 |
1 |
5 |
5 |
| 6-8 |
5 |
7 |
35 |
| 8-10 |
6 |
9 |
54 |
| 10-12 |
2 |
11 |
22 |
| 12-14 |
3 |
13 |
39 |
| Σfi= 20 |
Σfixi=162 |
Mean = x̄ = ∑fi xi /∑fi
= 162/20
x̄ = 8.1
2. In a pack of boxes, there are varying numbers of mangoes. Given below is the distribution of mangoes by the number of boxes.
Number of mangoes 50-52 53-55 56-58 59-61 62-64
Number of boxes 15 110 135 115 25
Find the mean.
Solution.
As the given data is not continuous, we need to add 0.5 to the upper limit and subtract 0.45 from the lower limit.
Assumed mean (A) = 57
Class size (h) = 3
Mean = x̄ = A +h ∑fidi /∑fi
= 57 + 3(75/400)
= 57 + 0.1875
= 57.19
The mean of mangoes distribution for each box is 57.19.
3. Given below is a record of 40 student’s total absentees. Find the mean number of days a student was absent.
Number of days 0-6 6-10 10-14 14-20 20-28 28-38 38-40
Number of students 11 10 7 4 4 3 1
Solution.
Midpoint (xi) = (upper limit + lower limit)/2
Mean = x̄ = ∑fixi /∑fi
= 499/40
= 12.48 days
Therefore the mean = 12.48.
FAQs on Statistics
Q: What is the definition of statistics?
Q: What are the types of statistics?
Q: What are the three main things to find in a statistic’s question?
Q: In how many ways can data be represented?
Q: How many ways are there to calculate the mean?
Maths Statistics Exam
Student Forum
Other Class 11th Maths Chapters
Popular Courses After 12th
Exams accepted
CA FoundationExams accepted
ICSI ExamExams accepted
BHU UET | GLAET | GD Goenka TestBachelor of Business Administration & Bachelor of Law
Exams accepted
CLAT | LSAT India | AIBEExams accepted
IPMAT | NMIMS - NPAT | SET
Exams accepted
BHU UET | KUK Entrance Exam | JMI Entrance ExamBachelor of Design in Animation (BDes)
Exams accepted
UCEED | NIFT Entrance Exam | NID Entrance ExamBA LLB (Bachelor of Arts + Bachelor of Laws)
Exams accepted
CLAT | AILET | LSAT IndiaBachelor of Journalism & Mass Communication (BJMC)
Exams accepted
LUACMAT | SRMHCAT | GD Goenka Test

