Rachit Kumar SaxenaManager-Editorial
What are Frequency Polygons?
Frequency represents quantitative data. By joining the center points of a histogram's rectangles, the diagram or figure so formed is known as a frequency polygon. You can observe a slope which denotes the rate of increase or decrease in the value. Thus, a frequency polygon is a graph constructed by joining the midpoints of each interval.
Explanation
Source: NCERT
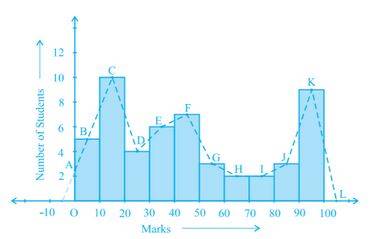
From the above diagram, we can say the area ABCDEFGH is the frequency polygon for the data corresponding to the image's right side.
Class-Mark
Frequency polygons can be drawn independently without drawing histograms. This can be done using class-marks.
We require the mid-points of the class intervals used in the data. These mid-points of the class-intervals are known as class-marks.
Class-Mark = Upper limit+Lower limit/2.
Use of Frequency Polygons
The frequency polygons are used in the following cases and situations:
- When the data is large, extensive, and continuous form.
- For comparing the two different sets of data having the same nature.
Illustrated Examples on Frequency Polygons
1. Consider the marks, out of 100, obtained by 51 students of a class in a test, given in the table. Draw a frequency polygon corresponding to this frequency distribution table.
| Marks |
Number of students |
|---|---|
| 0-10 |
5 |
| 10-20 |
10 |
| 20-30 |
4 |
| 30-40 |
6 |
| 40-50 |
7 |
| 50-60 |
3 |
| 60-70 |
2 |
| 70-80 |
2 |
| 80-90 |
3 |
| 90-100 |
9 |
| Total |
51 |
Solution.
Let us first draw a histogram for this data and mark the mid-points of the rectangles' tops as B, C, D, E, F, G, H, I, J, K, respectively. The point where this line segment meets the vertical axis is marked as A. Let L be the mid-point of the class succeeding the last class of the given data. The OABCDEFGHIJKL is the frequency polygon, which is shown.
2. In a city, the weekly observations made in a study on the cost of living index are given in the following table. Find the class-marks for all the classes.
| Cost of living index |
Number of weeks |
|---|---|
| 140-150 |
5 |
| 150-160 |
10 |
| 160-170 |
20 |
| 170-180 |
9 |
| 180-190 |
6 |
| 190-200 |
2 |
| Total |
52 |
Solution.
Let us find the class-marks of the classes given above, that is of 140 - 150, 150 - 160,... For 140 - 150, the upper limit = 150, and the lower limit = 140.
So, the class-mark = 150+140/2= 290/2= 145.
Continuing in the same manner, we find the class-marks of the other classes as well.
The table is as follows:
| Classes |
Class-marks |
Frequency |
|---|---|---|
| 140-150 |
145 |
5 |
| 150-160 |
155 |
10 |
| 160-170 |
165 |
20 |
| 170-180 |
175 |
9 |
| 180-190 |
185 |
6 |
| 190-200 |
195 |
2 |
| Total |
52 |
3. Draw a frequency polygon for the data above (without constructing a histogram).
Solution.
We can now draw a frequency polygon by plotting the class-marks along the horizontal axis, the frequencies along the vertical axis, and then plotting and joining the points. So, the resultant frequency polygon will be ABCDEFGH.
Image Source: NCERT
FAQs on frequency polygon
- Sheets
- Pictorial representation
- Graphical representation
Q: What are the advantages of the frequency polygon?
- Comparing the results becomes easier.
- A clear picture of the graphs and data along with understanding them easily.
- Easy and time-saving process of drawing the graphs.
Q: What are the steps to draw a frequency polygon?
- Draw a histogram.
- Select the class interval and mark the values on X-axis.
- The mid-value of each interval needs to be marked.
- The frequency is to be marked on the Y-axis.
- Mark the points at the middle of the class interval, which corresponds to each class interval's frequency.
- Connect the points.
Q: When are frequency polygons helpful?
Q: Is frequency polygon a line graph?
News & Updates
Maths Statistics Exam
Student Forum
Popular Courses After 12th
Exams: BHU UET | KUK Entrance Exam | JMI Entrance Exam
Bachelor of Design in Animation (BDes)
Exams: UCEED | NIFT Entrance Exam | NID Entrance Exam
BA LLB (Bachelor of Arts + Bachelor of Laws)
Exams: CLAT | AILET | LSAT India
Bachelor of Journalism & Mass Communication (BJMC)
Exams: LUACMAT | SRMHCAT | GD Goenka Test


