Rachit Kumar SaxenaManager-Editorial
What is Central Tendency?
A central tendency metric is a summary statistic that reflects a dataset's centre point or normal meaning. Such measurements show where most values fall in distribution and are often referred to as a distribution's core position. In statistics, the mean, median, and mode are the three most important indicators of central tendency. Using a separate form, each of these measures determines the direction of the centre point.
Mean
The mean is the average of arithmetic, and it is perhaps the most familiar indicator of central tendency. It is straightforward to measure the median. All the values are only summed together and separated by the number of measurements in the dataset.
The mean estimation involves all of the values in the results. If some amount is modified, the mean value increases. However, the average does not necessarily correctly find the data centre.
Median
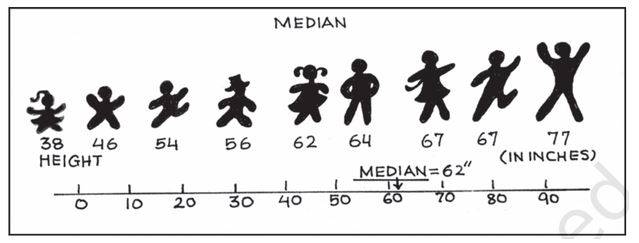
The middle average is the median. It is the value that divides the dataset in half. Order the data from the smallest to the highest to reach the median, and then find the data point that has an equivalent number of values above and below it. Based on if the sample contains an even or odd number of values, the procedure for finding the median differs slightly.
Mode
Mode is the value in your data collection that happens more often. On a bar map, the highest bar is the mode. If the data has several values that are more commonly bound to arise, you have a multimodal distribution. If no attribute is replicated, no mode is used for the data.
Mode is basically the only indicator of the core tendency that you can use for categorical details, such as an ice cream's most desired flavour. For categorical details, however, there is not a core meaning since the classes may not be organized. The mode may be a value that is not in the middle, with ordinal and discrete details. Again, the most common value is expressed by the mode.
Mean, Median, or Mode, which is widely used?
The mean, median, and mode are identical when you have asymmetric distribution for continuous results. In this scenario, since it involves all the details in the equations, researchers prefer to use the mean. However, the median is always the better predictor of core tendency if you have a distorted distribution.
Weightage of Central Tendency in Class 9
This concept is taught in chapter statistics. You will learn about the types of central tendencies and their applications. This concept has relevance in higher classes. The weightage of this chapter is 5 marks.
Illustrated Examples on Central Tendency
1. What is the median: 4, 5, 8, 9, 12, 14?
Solution:
The middle two values are: 8 and 9
Hence, median = (8+9)/2
= 8.5
2. Find the mean of 9, 2, 3, 4, 6, 8, 12, 1.
Solution:
The mean = (9+2+3+4+6+8+12+1)/8
= 5.6
3.Find the mean and median of the given data: 3, 5, 7, 9, 11, 14.
Solution:
The middle two values are: 7 and 9
Hence, median = (7+9)/2
= 8
The mean = (3+5+7+9+11+14)/6
= 8.1
FAQs on Central Tendency
Q: Why is the mean resistant but not the median?
Q: What is central tendency?
Q: What are the central-tendency indicators?
Q: How will a median of even numbers be found?
Step 1: Organize in ascending order.
Step 2: Take the average of the two values in the centre.
Q: What is the significance of central tendency?
News & Updates
Maths Statistics Exam
Student Forum
Popular Courses After 12th
Exams: BHU UET | KUK Entrance Exam | JMI Entrance Exam
Bachelor of Design in Animation (BDes)
Exams: UCEED | NIFT Entrance Exam | NID Entrance Exam
BA LLB (Bachelor of Arts + Bachelor of Laws)
Exams: CLAT | AILET | LSAT India
Bachelor of Journalism & Mass Communication (BJMC)
Exams: LUACMAT | SRMHCAT | GD Goenka Test


