Rachit Kumar SaxenaManager-Editorial
What is Parabola?
A parabola is a curve whose equation is f(x)= ax2+bx+c, which is the normal form of a parabola. To draw a parabola, we need to define the vertex first. This can be achieved by solving the equation x=-b/2a, and then having y= f (-b/2a) Plotting the graph, where the quadratic equation is given in the form of f(x) = a (x-h)2 + k, where (a, k) is the vertex of the parabola, is its vertex form. Find the vertex, focus, and directrix for a parabola here.
We know f(x) = ax2 + bx + c and a, b and c are constants, while x is the vector. By locating the values of x and y or by f(x), we will plot all the points in the graph, and by joining them, we will get the appropriate form. Later, we can create and graph a parabola.
How to graph a parabola?
Two points will describe a line. We have to find more than two points for the parabola to map it. We need to decide on five key points for a design that would be aesthetically pleasing. To begin our parabola, we start by inputting the details.
Suppose we have a quadratic equation of the form y=ax2 + bx + c , where a, b, and c are variable. To evaluate the values of x, you have to find the y-values. Now, the values of x and y will take us to the position of the point where the required parabola intersects the y-axis. By using these points and the X-axis, we can draw a line.
Weightage of Parabola Graph
This concept is taught under the chapter Conic Sections. You will learn about the parabolic graph and its applications in plotting equations. The weightage of this chapter is 4-7 marks in the final exams.
Illustrated Examples on Parabola Graph
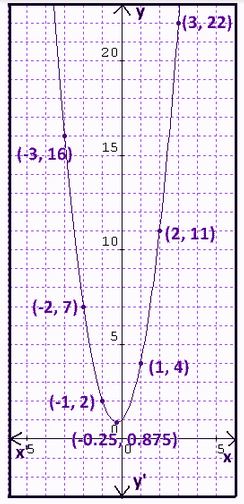
1. Draw a graph for the equation y = 2x2 + x+ 1.
Solution. The given equation is y = 2x2 + x+ 1.
Here, a = 2, b = 1 and c = 1.
It needs to find the vertex now
x = -b/(2a)
x = -1/(2(2))
x = -1/ 4
x = -0.25
Now putting x = -0.25 in the equation y= 2x2 + x+ 1
y= 2(-0.25)2 + (-0.25)+ 1.
y = 2(0.0625) – 0.25+1
y = 0.125 – 0.25 +1
y = 0.875
Now putting the different values for x and calculate the corresponding values for y.
When x = 1 ⇒ y= 2x2 + x+ 1 ⇒ y = 2(1)2+ 1 + 1 ⇒ y = 2+ 1 + 1 ⇒ y = 4
When x = 2 ⇒ y= 2x2 + x+ 1 ⇒ y = 2(2)2+ 2 + 1 ⇒ y = 8+ 2 + 1 ⇒ y = 11
When x = 3 ⇒ y= 2x2 + x+ 1 ⇒ y = 2(3)2+ 3 + 1 ⇒ y = 18+ 3 + 1 ⇒ y = 22
When x = -1 ⇒ y= 2x2+ x+ 1 ⇒ y = 2(-1)2– 1 + 1 ⇒ y = 2- 1 + 1 ⇒ y = 2
When x = -2 ⇒ y=2x2+ x+ 1 ⇒ y = 2(-2)2– 2 + 1 ⇒ y = 8- 2 + 1 ⇒ y = 7
When x = -3 ⇒ y= 2x2 + x+ 1 ⇒ y = 2(-3)2– 3 + 1 ⇒ y = 18 -3 + 1 ⇒ y = 16
Hence,
| x |
1 |
2 |
3 |
-1 |
-2 |
-3 |
| y |
4 |
11 |
22 |
2 |
7 |
16 |
FAQs on Parabola Graph
Q: What is a parabola?
Q: What is the primary property of parabola?
Q: What are some examples of parabolas? Why are they useful?
A: A common example is when you stir up carbonated drinks, such as orange juice, in a glass by rotating it around its axis. The liquid level increases on the outer edges of mugs and decreases slightly in the centre.
Q: Write differences between hyperbola and parabola.
A: A parabola is a set of points in a plane equidistant from a straight line or directrix and a focus, leaving an inflection point. The hyperbola refers to the distance between a set of points present in a plane to two fixed points, where the difference is positive.
Q: What are parabolas used for?
A: A parabola is an important tool used in NASA for designing headlamps and calculating missile trajectories. They are constantly used in engineering, physics, and many other scientific fields.
News & Updates
Conic Sections Exam
Student Forum
Popular Courses After 12th
Exams: BHU UET | KUK Entrance Exam | JMI Entrance Exam
Bachelor of Design in Animation (BDes)
Exams: UCEED | NIFT Entrance Exam | NID Entrance Exam
BA LLB (Bachelor of Arts + Bachelor of Laws)
Exams: CLAT | AILET | LSAT India
Bachelor of Journalism & Mass Communication (BJMC)
Exams: LUACMAT | SRMHCAT | GD Goenka Test
