- What is Correlation?
- Weightage and Importance of Correlation
- Illustrative Examples on Correlation
- FAQs on Correlation
What is Correlation?
Correlation is the process by which you can relate two variables in mathematics. While there are various measures to understand the relation between two variables, correlation is one of the most common approaches. Correlation as a concept is important and is relevant in statistics, higher mathematics, and applied mathematics.
The Correlation Coefficient
A correlation coefficient is the measure of the relation between two variables. It is close to the number 0 and may have a positive or a negative value. This correlation coefficient has a range between +1 and -1 and is usually denoted by the symbol ‘r’.
Types of Correlation
One can use scatter plots or diagrams to find the correlation between two statistical variables. It represents how two statistical variables are correlated.
- No Correlation: When the statistical variables are not linearly dependent on one another, or if there is no relationship between the two statistical variables.
- Positive Correlation: When the value of one of the two statistical variables increases concerning another component in correlation.
- Negative Correlation: When the value of one of the two statistical variables decreases concerning another component in correlation.
Correlation Formula
The correlation coefficient for ordinal scales is calculated using Spearman’s rho coefficient.
Correlation gives you the measure of the relationship between two statistical variables---correlation coefficient in this respect shows this correlation.
A few of the formulas are:
Karl Pearson’s Correlation Formula
The most common correlation formula is the Karl Pearson method to find the linear dependency between 2 defined sets of data. The following equation gives the formula:
Σx = Sum of First Variable Value
Σy = Sum of Second Variable Value
Σxy = Sum of the Product of Both Variable Values
Σx2 = Sum of the Squares of the First Variable Value
Σy2 = Sum of the Squares of the Second Variable Value
Weightage and Importance of Correlation
Correlation is a major statistics’ topics which are taught in class 11. This topic carries a major weightage of 5-10 marks in the final examination. This is also covered in Maths for economics in class 11.
Illustrative Examples on Correlation
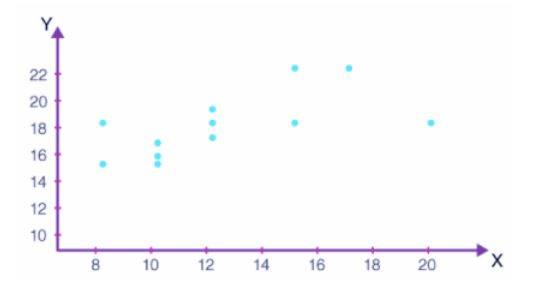
1. Consider the table of observations below:
| Sl |
X |
Y |
|---|---|---|
| 1 |
10 |
16 |
| 2 |
12 |
17 |
| 3 |
15 |
18 |
| 4 |
8 |
15 |
| 5 |
20 |
18 |
| 6 |
17 |
22 |
| 7 |
12 |
19 |
| 8 |
15 |
22 |
| 9 |
12 |
18 |
| 10 |
10 |
15 |
| 11 |
8 |
18 |
| 12 |
10 |
16 |
The X mean: 12.4
The Y means: 17.8
If we solve using the Karl Pearson formula, we can find its correlation coefficient as well.
A scatter diagram can be used to understand the correlation between the X and Y values.
2. What is the range of the correlation coefficient:
(a) 0 to infinity
(b) -1 to +1
(c) minus infinity to infinity
Solution.
(b) -1 ≤ r ≤ 1.
3. If rXY has a positive value, the relationship between X and Y is:
(a) when Y increases X does not change
(b) when Y decreases X increases
(c) when Y increases X increases
Solution.
(c) If r is positive, the two variables move in the same direction.
FAQs on Correlation
Q: What is a correlation in mathematics?
Q: What is a correlation coefficient in mathematics?
Q: What is the formula for correlation of 2 variables?
Q: What are the different types of correlation in math?
Negative Correlation (-1)
No Correlation(0)
Q: What is the use of a scatter diagram for correlation?
Maths Statistics Exam
Student Forum
Other Topics under this Chapter
Other Class 11th Maths Chapters
Popular Courses After 12th
Exams accepted
CA FoundationExams accepted
ICSI ExamExams accepted
BHU UET | GLAET | GD Goenka TestBachelor of Business Administration & Bachelor of Law
Exams accepted
CLAT | LSAT India | AIBEExams accepted
IPMAT | NMIMS - NPAT | SET
Exams accepted
BHU UET | KUK Entrance Exam | JMI Entrance ExamBachelor of Design in Animation (BDes)
Exams accepted
UCEED | NIFT Entrance Exam | NID Entrance ExamBA LLB (Bachelor of Arts + Bachelor of Laws)
Exams accepted
CLAT | AILET | LSAT IndiaBachelor of Journalism & Mass Communication (BJMC)
Exams accepted
LUACMAT | SRMHCAT | GD Goenka Test


