Rachit Kumar SaxenaManager-Editorial
What is T Distribution?
The T distribution also called Student's T Distribution, belongs to the distribution family that looks almost identical to the normal distribution curve but a bit shorter and fatter. The t distribution is used instead of the normal distribution when the samples are small. The larger the sample size, the more the t distribution looks similar to the normal distribution. For sample sizes larger than 20, the distribution seems almost exactly like the normal distribution.
Explanation
The T distribution is a continuous probability distribution of the z-score and the estimated standard deviation is used in the denominator. The T distribution, just like the normal distribution, is bell-shaped and symmetric with heavier tails, which means that it tends to produce values falling far from its mean. They are used to estimate significance.
Degrees of Freedom
The heaviness tail in the case of T-distribution is determined by the parameter known as the degree of freedom. It describes the form and shape of the bell-shaped t distribution. The larger the degree of freedom is the more similar it looks to a normal distribution. Suppose the degree of freedom is more than 30, then it looks just like a normal distribution.
If sigma=s, t=z the distribution becomes a normal distribution. As N increases, Student's t-distribution moves towards the normal distribution.
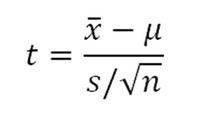
When you draw a simple random sample of size n from a population that has an approximately a normal distribution with mean μ and unknown population standard deviation σ we can calculate the t-score:
Where,
t=Student's t-distribution
X bar = sample mean
ᘈ =population mean
s =sample standard deviation
{n} =sample size
Weightage of T-Distribution
T-distribution is a part of statistics and carries 11 marks weightage in Class 10th and class 11th a combined weightage of 8 marks with probability.
Illustrative examples on T-Distribution
1. For example, if we have a sample of size n = 20 items, then calculate the degrees of freedom.
Solution:
We calculate the degree of freedom as:
df = n – 1 = 20 – 1 = 19 and we write the distribution as T ~ t19.
2. You have sampled 20 students from two different classes to estimate the mean standardized test scores and check if there is any difference between the two groups.
Solution:
Using a two-tailed t-test, we can estimate the difference between the two classes and a confidence interval around that estimate. From the t-test, you find the difference in average score between class 1 and class 2 is 4.61, with a 95% confidence interval of 5.31 to 3.88.
3. Consider the following variables are given to you:
Population mean = 310
Standard deviation = 50
Size of the sample = 16
Sample mean = 290
Calculate the t-distribution value.
Solution:
Here all the values are given. We just need to incorporate the values in the formula which will be
Value of t = (290 – 310) / (50 / √16)
T Value = -1.60
FAQs on T-Distribution
Q: What are the values of the t-table?
Q: What is the limitation of using a t-distribution?
Q: What is the critical value?
Q: What are the applications of t distribution?
Test of the Hypothesis of the population mean,
The difference between the two means,
The difference between two means with dependent samples, and
About the coefficient of correlation.
News & Updates
Maths Statistics Exam
Student Forum
Popular Courses After 12th
Exams: BHU UET | KUK Entrance Exam | JMI Entrance Exam
Bachelor of Design in Animation (BDes)
Exams: UCEED | NIFT Entrance Exam | NID Entrance Exam
BA LLB (Bachelor of Arts + Bachelor of Laws)
Exams: CLAT | AILET | LSAT India
Bachelor of Journalism & Mass Communication (BJMC)
Exams: LUACMAT | SRMHCAT | GD Goenka Test


