Rachit Kumar SaxenaManager-Editorial
What is the Extrapolation Method?
In statistics, extrapolation is a method by which you can estimate a data set value beyond its range. Using extrapolation, you can find a dataset’s value even if it continues for a longer period.
In statistics, there are three main types of extrapolation.
Linear Extrapolation
Linear extrapolation helps when the dataset you are trying to estimate is not too far away. To use this method, draw a tangent line at the last point in a graph and extend it beyond its limits.
For example, if x1 = 0.3 and y1 = 1.8 and x2 = 0.5 and y2 = 2.1 are four points on a straight line at x = 1.2, then by linear extrapolation, we have, y (x) = x1 + (( x - x1) / (x2 - x1) ( y2 - y1)).
By substituting the values, we get, y (1.2) = 0.3 + ((1.2 - 0.3) / (0.5 - 0.3) ( 2.1 - 1.8))
Or, y (1.2) = 0.3 + ( 4.5 * 0.3 ) = 0.3 + 1.35= 1.65.
Conic Extrapolation
In conic extrapolation, you make a conic section using the last five data points. If you get a parabola or hyperbola, then there is no curve since the conic section is relative to the x-axis. But if you get an ellipse or a circle, then you get a curve.
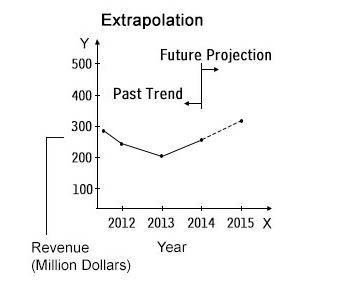
For example, consider the graph that shows the revenue trends and future projections from the year 2012 to 2015.
So, according to conic extrapolation, you have, y (x) = x1 + (( x - x1) / (x2 - x1) ( y2 - y1)).
Here, x1= 300, y1 = 250, x2 = 200, and y2 = 300. Also, x = 350.
By substituting the values in the graph into the expression, you get,
Y (350) = 300 + (( 350 - 300) / (200 - 300) (300 - 250))
Y (350) = 300 - 100
Y (350) = 200.
Polynomial Extrapolation
In this type of extrapolation, you draw a polynomial curve for all the data points. The method makes use of Newton’s Finite Series or Lagrange’s Interpolation.
You can also use the extrapolation formula to derive the dataset you need. Consider a linear graph. This graph assumes two points, (a, b) and (a1, b1). Here, it would help if you found the value of ‘a’ for which you need to extrapolate. So, according to the extrapolation formula:
B (a) = b1 + ((a–a1) / (b–b1) (b2–b1)).
Weightage of Extrapolation for Class 11
The topic, ‘Extrapolation’ is a part of ‘Statistics’ for class 11. Here, you will learn about the different types of extrapolation and their applications. The chapter carries 10 marks in the exam.
Illustrative Examples on Extrapolation
1. If (2, 6) and (4, 10) are two points on a straight line, find the b, when a = 6 using linear extrapolation.
Solution:
Given a1 = 2 and b1 = 6
Similarly, a2 = 4 and b2 = 10.
And a = 6.
We know that b(a) = b1 + ((a–a1) / (a2–a1) (b2–b1))
Therefore, by substituting the values in the above equation, we get, b (6) = 6 + ((6–2) / (4 2)) (10–6).
Or, b (6) = 6 + ((4 / 2)) (4).
Thus, by solving the above equation, we get, b (6) = 14.
2.If (4, 8) and (10, 6) are two points on a straight line, find the value of ‘b’ when a = 8 using linear extrapolation.
Solution:
Given a1 = 4, b1 = 2, a2 = 10, b2 = 6, and a = 8.
Substituting the above values in the equation b(a) = b1 + ((a–a1) / (a2–a1) (b2–b1)), we get,
B (8) = 2 + ((8 - 4) / (10–4)) (6–2).
So, b (8) = 6 + (4 / 6) 4
Or, b (8) = 6 + 2.667.
Therefore, b (8) = 8.667.
3. If (6, 3) and (8, 9) are two points on a straight line, find the value of ‘b’ when a = 12 using linear extrapolation.
Solution:
Given, a1 = 6, b1 = 3, a2 = 8, b2= 9, and a = 12.
By substituting the values in the equation b(a) = b1 + ((a–a1) / (a2–a1) (b2–b1), we get,
B (12) = 3 + ((12–6) / (8–6)) (9 - 3)
Or, B (12) = 3 + (6 / 2) (6)
By solving the above equation, we get, B (12) = 21.
FAQs on Extrapolation
Q: What are the Differences between Interpolation and Extrapolation?
However, if the dependent variable’s value lies outside the limits, we use the extrapolation method to determine the value of the independent variable.
Q: What are the Assumptions of Extrapolation?
There are no consecutive missing values in the series.
Q: Who invented the concept ‘Extrapolation?’
Q: What is the Other Name for Extrapolation?
Q: What are the Uses of the Extrapolation Method?
-Know the future limit ranges
News & Updates
Maths Statistics Exam
Student Forum
Popular Courses After 12th
Exams: BHU UET | KUK Entrance Exam | JMI Entrance Exam
Bachelor of Design in Animation (BDes)
Exams: UCEED | NIFT Entrance Exam | NID Entrance Exam
BA LLB (Bachelor of Arts + Bachelor of Laws)
Exams: CLAT | AILET | LSAT India
Bachelor of Journalism & Mass Communication (BJMC)
Exams: LUACMAT | SRMHCAT | GD Goenka Test


