- What is mean and median?
- Weightage of Difference between mean and median in Class X
- Illustrative Example on Difference between mean and median
- FAQs on Difference between mean and median
What is mean and median?
Mean, and Median have their importance in statistics. When the data is bigger, it is difficult to compare this data, and at this point, mean and median comes into the picture.
Mean
Mean can be defined as the sum of all the observations divided by the number of observations. There are different types of means- Arithmetic mean, Harmonic mean, Geometric mean, Quadratic mean, etc.
Mean = (a1 + a2 + a3 + a4 + …. + an)/n
Median
The number present in the middle of the set is known as the median. Median is used to separate the set into two equal sets: the upper half set and the lower half set.
Arrange the observations in ascending order and pick the middle number. This is easy when you have an odd number of observations, but for even observations, select the middle pair, add it and divide it by two.
Median = {(n+1)/2} (For odd observations)
Median = [(n/2) th term + {(n+1)/2} th term]/2
Difference between mean and median
| Median |
Mean |
|---|---|
| The number present in the middle of the set is known as the median. |
Mean can be defined as the sum of all the observations divided by the number of observations. |
| Applied for skewed distribution |
Applied for formal distribution |
| This is a positional average. |
This is an arithmetic average. |
| Extreme scores do not affect the median. |
Extreme scores affect the mean. |
| Median applies to the most robust data and can even measure the uneven data as well. |
Mean is affected by various external factors and cannot give results. |
| It is not sensitive to outlier data. |
It is sensitive to outlier data. |
| It provides the centre of gravity of the centre point of the set. |
It provides the mid-value of the set. |
Weightage of Difference between mean and median in Class X
In the chapter, ‘Statistics,’ you will understand the mean, median, and mode in detail, along with the graphical representation of cumulative frequency distribution.
Illustrative Example on Difference between mean and median
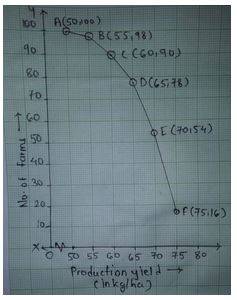
1. The following table gives the productivity yield per hectare of wheat of 100 villages. Change the distribution to a more than type distribution and draw its ogive.
| Production yield in kgs |
50-55 |
55-60 |
60-65 |
65-70 |
70-75 |
75-80 |
| Number of farms |
2 |
8 |
12 |
24 |
38 |
16 |
Solution.
> 50 2 + 98 = 100
> 55 8 + 90 = 98
> 60 12 + 78 = 90
> 65 24 + 54 = 78
> 70 38 + 16 = 54
> 75 16
Coordinates are A (50,100), B(55,98), C(60,90), D(65,78), E(70,54), F(75,16)
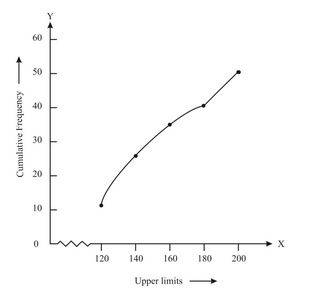
2. The following distribution gives the daily income of 50 workers. Change the distribution to a less than type cumulative frequency distribution and draw its ogive.
| Daily income |
100-120 |
120-140 |
140-160 |
160-180 |
180-200 |
| No. of workers |
12 |
14 |
8 |
6 |
10 |
Solution.
Daily income No. of workers
Coordinates are A(120,12), B(140,26), C(160,34), D(180,40), E(200,50)
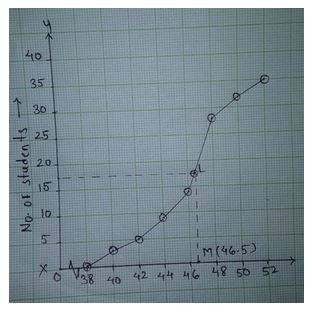
3. During the medical check-up of 35 students, their weights are recorded as follows. Draw a less than type ogive for the data. Hence obtain the median weight from the graph and verify the result by using the formula.
| Weight (in kgs) |
No. of students |
|
|
0 |
|
|
3 |
|
|
5 |
|
|
9 |
|
|
14 |
|
|
28 |
|
|
32 |
|
|
35 |
Solution.
∑fi = 35, so n =35
= n/2 = 17.5
Weight No. of students
0-38 0
38-40 3 - 0 = 3
40-42 5 - 3 = 2
42-44 9 - 5 = 4
44-46 14 - 9 = 5
46-48 28 - 14 = 14
48-50 32 - 28 = 4
50-52 35 - 32 = 3
Median class = 46-48, I= 46, c= 14, f= 14, h= 40 -38 = 2, n/2= 17.5
Median = I + {[(n/2) - c]/f} * h
= 46 + {[(17.5)- 14]/14} * 2
= 46.5
FAQs on Difference between mean and median
Q: What is the mean?
Q: What is the median?
Q: What are the different kinds of means?
Q: Where do you use the skewed type of distribution?
Q: Which is sensitive towards outlier data?
Q: Which uses positional and arithmetic average?
Maths Statistics Exam
Student Forum
Popular Courses After 12th
Exams accepted
CA FoundationExams accepted
ICSI ExamExams accepted
BHU UET | GLAET | GD Goenka TestBachelor of Business Administration & Bachelor of Law
Exams accepted
CLAT | LSAT India | AIBEExams accepted
IPMAT | NMIMS - NPAT | SET
Exams accepted
BHU UET | KUK Entrance Exam | JMI Entrance ExamBachelor of Design in Animation (BDes)
Exams accepted
UCEED | NIFT Entrance Exam | NID Entrance ExamBA LLB (Bachelor of Arts + Bachelor of Laws)
Exams accepted
CLAT | AILET | LSAT IndiaBachelor of Journalism & Mass Communication (BJMC)
Exams accepted
LUACMAT | SRMHCAT | GD Goenka Test


