Rachit Kumar SaxenaManager-Editorial
What are the Statistics Definitions?
Statistics is a branch of mathematics that deals with collecting and analysing data to make interpretations and finally represent the data in a visually understandable form.
Types of Statistics
Descriptive Statistics: It is the summary statistics that summarise the information in the data quantitatively.
Inferential Statistics: It is the statistics that analyses the data to get conclusions.
What Is Data?
Data is a collection of information, such as observations, numbers, measurements, etc.
Types of Data:
Qualitative Data: It is the descriptive form of data. For example, the Sun rises in the east.
Quantitative Data: It is the data in the form of numbers. For example, an octopus has eight legs.
Types of Quantitative Data:
Discrete Data: It is the fixed value data and cannot be counted. For example, True and False.
Continuous Data: It is not fixed and is in the form of range. For example, the car has a mileage of 24mph.
Description of Data
Data can be described in one of the following ways:
Median: It is the middle value in the data and divides the list into two halves.
Mode: It is the number that repeats in the list of data.
Mean: It is the average of the data present in the list and is calculated as the total of all data divided by the total data points.
Range: It is calculated by subtracting the lowest number from the highest number on the list.
Representation of Data
Data can be represented visually in the following form that helps to understand the data well:
Bar Graph: A bar graph is the data representation in the form of rectangular bars. The length of the bar represents the value it holds. These can be horizontal as well as vertical.
Pie Chart: It is the circle graph in which different sectors represent the data of different categories.
Line Graph: It consists of the line that joins the different data points.
About Statistics
Statistics is an important discipline of mathematics, which helps students to understand advanced topics. These topics include differential equations, linear algebra, probability, and linear algebra. It has a wide scope in the fields of weather forecasting, geology, sociology, etc. Therefore, it is necessary to understand the concept of statistics well.
Weightage of Statistics
Statistics is a chapter in Class IX and Class X Mathematics syllabus. Students will learn about various techniques to analyse and represent the data visually. Students can expect 3 or 4 questions from this topic in the exam.
Illustrated Examples on Statistics
1. What is the mean in the below list of marks of class 10 students?
50, 50, 45, 39, 44, 49, 41, 36, 30, 35
Solution:
Mean = (50+50+45+39+44+49+41+36+30+35)/10 = 419/10 = 41.9
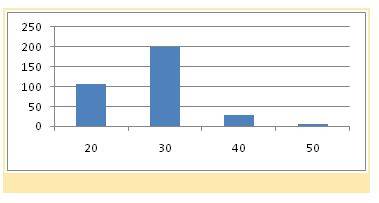
2.Represent the below data as a bar graph:
| Savings |
Employees |
|---|---|
| 20 |
105 |
| 30 |
199 |
| 40 |
29 |
| 50 |
73 |
| Total |
400 |
Solution:
3. Find the median in the below data:
24, 35, 41, 51, 62, 62, 74, 77, 76, 90
Solution:
Data is already sorted in increasing order. The number of data points is 10. So take the mean of 5th and 6th data points.
Median = (62+62)/2 = 114/2 = 57
FAQs on Statistics
Q: What are the types of statistics?
Q: What are the different ways to represent data visually?
Q: What is an example of statistics?
Q: What is the range of data?
Q: What are the methods used in statistics?
Summarisation
Analysis
News & Updates
Statistics Exam
Student Forum
Popular Courses After 12th
Exams: BHU UET | KUK Entrance Exam | JMI Entrance Exam
Bachelor of Design in Animation (BDes)
Exams: UCEED | NIFT Entrance Exam | NID Entrance Exam
BA LLB (Bachelor of Arts + Bachelor of Laws)
Exams: CLAT | AILET | LSAT India
Bachelor of Journalism & Mass Communication (BJMC)
Exams: LUACMAT | SRMHCAT | GD Goenka Test
