Rachit Kumar SaxenaManager-Editorial
What is T-test table?
Statistics is a field in which data are collected, structured, processed, interpreted, and displayed. It is traditional to start with a sample data or statistical model in the application of statistics on research, commercial or societal issues.
A t-test can be represented in statistics as a predictive hypothesis test, where the test statistics hold the student’s t-distribution if a null hypothesis is formed. Therefore, here we use the t-test table. The approaches of two observation groups are evaluated in paired T-test. Each group should obtain the observations randomly. Therefore, it is the protocol and not other variables that are the explanation for the difference in response.
The T-test is used for creating observations regarding a known sample before and after an event has occurred. Such that, in the case of two samples, observations from both these samples are paired with each other for using T-test effectively with precision.
T-Test table
The T-Test table is used to identify the ratio for t-statistics and also for evaluating the proportions combined with z-scores. Moreover, the probability of t-values can also be deciphered from the t-distribution table for a given value. Therefore, the probability thus obtained gives the area between two t-distribution ordinates - infinity and given value.
The significant values for the probabilities of t-distribution, α to the degrees of freedom(df) are established with the help of a T-Test table. Below, we have attached T-Test tables for both one tail and two tails.
What is the Z distribution and Chi-squared distribution?
Z distribution and Chi-Squared are some of the most popular distribution patterns of probability, and it is vital to recognise the variations between them and when to use the distribution pattern. A Z table is of no use when the operation revolves around a smaller sample size.
On the other hand, the distribution of a sum of independent regular k squares in standard normal variables is the chi-square distribution of k degrees of freedom. The tests are used for the independence of two variables in an incident table and to assess the observable data for a matching result.
Weightage of T-test table
The T-test table is from the chapter statistics from the 11th standard. Apart from this topic, the chapter also covers the analysis of frequency distributions and measures of dispersions. The unit of statistics accounts for vital 10 marks in the final exam.
Illustrative Example on T-test table
1. Calculate t-test for the following data.
Solution.
- In the first step, we would be subtracting all the values of score 2 from score 1.
- Then we would be adding up all the values obtained.
- In the third step, we would be squaring up the value obtained from subtracting each subject.
- Then we would be adding up all the values obtained.
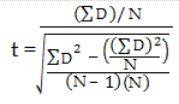
- In the final step, we would be using this formula to get the required t-test
Therefore, the required t-test value is -2.74. Thus, we can reject the null hypothesis for this value.
2. There are two sets: (2,7,8,9) and (4,3,2,1). Calculate t-test for the same.
Solution.
- In the first step, we would be subtracting all the values of score 2 from score 1.
- Then we would be adding up all the values obtained.
- In the third step, we would be squaring up the value obtained from subtracting each subject.
- Then we would be adding up all the values obtained.
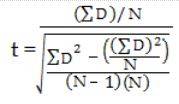
- In the final step, we would be using this formula to get the required t-test
Therefore, the required t-test value is 2.36
3. Calculate t-test for the following data.
| A |
B |
|---|---|
| 45 |
34 |
| 38 |
22 |
| 52 |
15 |
| 48 |
27 |
| 25 |
37 |
| 39 |
41 |
| 51 |
24 |
| 46 |
19 |
| 55 |
26 |
| 46 |
36 |
Solution.
- In the first step, we would be subtracting all the values of score 2 from score 1.
- Then we would be adding up all the values obtained.
- In the third step, we would be squaring up the value obtained from subtracting each subject.
- Then we would be adding up all the values obtained.
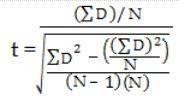
- In the final step, we would be using this formula to get the required t-test
Therefore, the required t-test value is 4.27
FAQs on T-test table
Q: What are the three primary types of t-tests?
Q: What is the use of a t-test?
Q: What is the p-value in t-tests?
Q: What is the basic difference between z-test and t-test?
Q: What is the other name given to the t-tests?
News & Updates
Statistics Exam
Student Forum
Popular Courses After 12th
Exams: BHU UET | KUK Entrance Exam | JMI Entrance Exam
Bachelor of Design in Animation (BDes)
Exams: UCEED | NIFT Entrance Exam | NID Entrance Exam
BA LLB (Bachelor of Arts + Bachelor of Laws)
Exams: CLAT | AILET | LSAT India
Bachelor of Journalism & Mass Communication (BJMC)
Exams: LUACMAT | SRMHCAT | GD Goenka Test


