Rachit Kumar SaxenaManager-Editorial
What are the Types of Statistics?
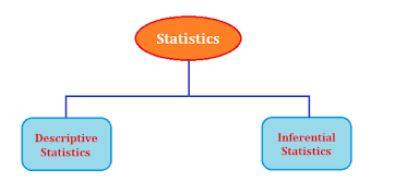
Statistics is a study of collecting, interpreting, analyzing, and summarizing data sets in mathematics theory. However, Statistics is considered an application of mathematics and the science of the different types of state, such as collection and interpretation of data regarding one nation consisting of its population, literacy, and economy. Basically, Statistics are classified into two types on the basis of given features, i.e., Descriptive and Inferential Statistics.
Types of Statistics
Descriptive statistics: Under Descriptive Statistics, the data set is summarized via given observations. However, the summarization is done from the population sample with different parameters like standard deviation or mean. Consequently, Descriptive Statistics is a mode to organize, represent and describe a data collection using graphs, tables, or summary measures.
Inferential Statistics: Under Inferential Statistics, individuals try to interpret the meaning of descriptive Statistics. This method allows us to use collected information from the sample to make predictions, inferences, or decisions from the population.
Weightage of Types of Statistics
Types of Statistics are a topic from the chapter Statistics. This chapter has a weightage of around 10 marks in Class XI. Every year, there are around 3 to 4 questions asked in the examination from this chapter. Other topics covered in the chapter are -
- Collection of Data
- Presentation of Data
- Graphical Representation of Data
- Measures of Central Tendency
Illustrative Examples on Types of Statistics
1. The stem and leaf display of a set of test marks is given below. Find out the Range of this set of marks.
4 2 5
5 4 4 7 7
6 0 1 2 2 4 5 8 8 9
7 3 5 5 8
8 7
Solution:
The Range is the difference between the highest and lowest marks.
Thus, the figures in stem represent ten digits of the test scores. Besides, the numbers in leaves represent the unit digits. So, the highest and lowest marks represented as 87 and 42
So, the Range will be 87-42 = 45.
2. In a random sample of 225 undergraduate men at UMD, that average best bench press is 150 pounds, with a sample standard deviation of 20 pounds. Calculate a 95% confidence interval for the average best bench press for UMD undergraduates.
Solution:
We will use the given formula for Interval:
3. The mean of a set of marks is 89, and the standard deviation is 12. What percent of scores fall between the raw marks and scores of 83 and 97 and 76 and 93, respectively?
Solution:
Percentage between 76 and 93 = 48.92. Percentage between 83 and 97 = 44.01
FAQs on Types of Statistics
Q: What are the different types of Statistics?
Descriptive Statistics
Inferential Statistics
Q: What is Descriptive Statistics used for?
Q: What is Inferential Statistics used for?
Q: How many types of Descriptive Statistics are there?
- Measure of Frequency
- Measure of Central Tendency
- Measure of Dispersion or Variation
- Measure of Position.
Q: What are the basic terms of Statistics?
- Population
- Parameter
- Sample
- Statistic
News & Updates
Statistics Exam
Student Forum
Popular Courses After 12th
Exams: BHU UET | KUK Entrance Exam | JMI Entrance Exam
Bachelor of Design in Animation (BDes)
Exams: UCEED | NIFT Entrance Exam | NID Entrance Exam
BA LLB (Bachelor of Arts + Bachelor of Laws)
Exams: CLAT | AILET | LSAT India
Bachelor of Journalism & Mass Communication (BJMC)
Exams: LUACMAT | SRMHCAT | GD Goenka Test


